Download

1 / 30
410 likes | 982 Vues
Pore Network Modelling for Carbonates using Pore Space Images An Integrated Workflow Approach. Anwar Al-Kharusi and Martin Blunt. Imperial College London, 20 th January 2006. Outline. Introduction New pore network extraction technique at a glance Applications on real datasets

E N D
Pore Network Modellingfor Carbonates using Pore Space ImagesAn Integrated Workflow Approach Anwar Al-Kharusi and Martin Blunt Imperial College London, 20th January 2006
Outline • Introduction • New pore network extraction technique at a glance • Applications on real datasets • Fontainebleau sandstone • Berea sandstone • Carbonate from subsurface Oman • Present work
Project Definition 3D micro-CT image 1 0 1 0 1 0 1 0 1 0 1 0 1 01 1 0 1 Voxelize Binarize Imaging software Multiple point statistics 3D binary file 2D image 2D binary file New algorithm PORENET Integrated workflow Predict transport properties Create 3D pore network model Coordination number, Pore size distribution, Throat size distribution, Porosity etc. Absolute permeability, Relative permeability, Capillary pressure etc. Compare with measured data
Pore Scale Modelling:Present Day Capabilities • Representations of the rock pore space [excellent] • Sedimentary process • Statistical methods (multiple point statistics, successful for carbonates - Okabe 2004) • Microtomography (resolution improving, poor for sub-micron pores in carbonates) • Extracting networks [verypoor, 3 networks at present] • Berea • Fontainebleau • Random close packing of equally sized spheres • Pore scale fluid flow simulations [excellent] • Two-phase fluid flow simulations (robust codes available) • Three-phase fluid flow simulations (improving)
Integrated modular research project Image representation Pore network extraction Predict transport properties Scale up from pore to log scale ?? Investigate Recovery processes
2D binary representation Image voxelization Image binarization 3D binary representation assuming isotropy using multiple point statistics [Okabe and Blunt, 2004] Present day micro-CT scanning cannot image sub-micron scale required for most carbonates
Pore Network Extraction Algorithm • Read image (reading all zero entries in 3D image) • Grow a maximal ball in each zero voxel location • Delete included balls • Depth first search algorithm • Make up structure for master and slave balls • Make up structure for cluster (equal) balls • Pore body and throat assignment • Common slaves/clusters • Rectifying subroutines • Use cluster structure to walk between 2 direct slaves • Use joining subroutine to join nearby large spheres • Delete isolated pores (not part of network) • Apply cluster cutting repair • Display codes • Skeleton view • Detailed pore/throat cell view per layer • Code split file for re-runs (after maximal ball computation) PORENET
Included sphere, will be deleted Calculating maximal balls Deleting Included balls
Sphere of radius 1 Sphere of radius 2 Sphere of radius 0 Required zeros to construct ball of radius 0 Required zeros to construct ball of radius 1 0 0 0 0 0 0 0 0
Build MASTER – SLAVE hierarchy Apply Depth First Search Largest master 1 Master to 7 Slave to 1 2 Master to 9 6 7 8 9 3 Slave to 2 Master to 2 & 6 Master to 8 Slave to 3 4 Slave to 4 5 [Relationship: The slave of ‘my slave’ becomes my ‘slave’] Arrangement by radius Attachment of slaves to parent Storing slave list information in largest master
Limited or bounded clusters Handling equal in radius spheres Connected equal spheres Touching cluster Cluster growth bounded by direct slaves Overlapping cluster Hierarchy for equal spheres Unlimited or unbounded clusters [Relationship: The cluster of ‘my cluster’ becomes my ‘cluster’] Cluster growth bounded by grains or used up cluster cells
Constructing pore bodies and throats Repair clusters suffering from cluster-cutting problems • Pore bodies are defined as largest master spheres plus: • their slaves (when no throat is available) • their clusters Pore body can be a complex entity of spheres Cluster-based throat Simple throat Different to concept described by Silin et al
Assignment of network properties Volumes obtained from original image voxels, overlap removed Pore body radius computed as effective radius of a sphere Throat radius computed as effective radius of a cylinder, length inferred from maximum distance between slaves Element shape factor assumed constant (0.048 of an equilateral triangle) Element clay volume not calculated Absolute permeability calculated assuming network saturated with single phase Capillary pressure and relative permeability computed using II-Phase fluid flow code [Valvatne and Blunt, 2004]
Simple hand-made test images GRAPH_code 1 1 0 1 1 1 1 1 1 1 1 1 1 1 1 1 1 1 1 1 1 0 0 0 1 1 1 1 1 1 1 1 1 1 1 1 1 0 1 1 0 0 0 0 0 0 0 0 0 0 0 0 0 0 0 0 0 0 0 1 1 0 0 0 1 1 1 1 1 1 1 1 1 1 1 1 1 0 1 1 1 1 0 1 1 1 1 1 1 1 1 1 1 1 1 1 1 1 1 1 1 1 1 1 1 1 1 1 1 1 1 1 1 1 1 1 1 1 1 1 1 1 1 1 1 1 1 1 1 0 1 1 1 1 1 1 1 1 1 1 1 1 1 1 1 1 1 1 0 0 0 1 1 1 1 1 1 1 1 1 1 1 1 1 1 1 1 1 1 0 1 1 1 1 1 1 1 1 1 1 1 1 1 1 1 1 1 1 1 0 1 1 1 1 1 1 1 1 1 1 1 0 1 1 1 1 1 1 1 0 1 1 1 1 1 1 1 1 0 1 0 0 0 0 0 0 0 0 0 0 0 0 0 0 0 0 0 0 0 0 1 0 1 1 1 1 1 1 1 0 1 1 1 1 1 1 1 1 0 1 1 1 1 1 1 1 1 1 1 0 1 1 1 1 1 1 1 1 1 1 1 1 1 1 1 1 1 1 1 0 1 1 1 1 1 1 1 1 1 1 1 1 1 1 1 1 1 1 1 0 1 1 1 1 1 1 1 1 1 1 1 1 1 1 1 1 1 1 1 0 1 1 1 1 1 1 1 1 1 1 1 1 1 1 1 1 1 1 1 0 1 1 1 1 1 1 1 1 1 1 1 1 1 1 1 1 1 1 0 0 0 1 1 1 1 1 1 1 1 1 1 1 1 1 1 1 1 1 1 0 1 1 1 1 1 1 1 1 1 1 2D cross-section highlighting two pore bodies (in red and in blue) with a connecting throat (in yellow) extracted from the Berea 64 voxel image. The ‘white’ space shows void space of the original image while the ‘grey’ space shows grains Skeleton_code
Network extraction from the Fontainebleau 3D image 3D image of the extracted pore network (75 voxels) A 3D pore-space image of the Fontainebleau sandstone. The pore space is shown in grey. The image was generated using micro-CT scanning with a resolution of 7.5 μm (300 voxels) Pore size distribution for the Fontainebleau sample Throat size distribution for the Fontainebleau sample
Coordination number distribution for the Fontainebleau sample Properties of the network extracted from 12 central cubic portions of the original 2.25mm 3D Fontainebleau image
Properties of the network extracted from 12 central cubic portions of the original 2.25mm 3D Fontainebleau image Comparison with measured properties for the Fontainebleau sample
Network extraction from the Berea 3D image Comparison of pore and throat size distribution for Berea between our network model and that of Øren and Bakke (2003) A 3D pore-space image of the Berea sandstone. The pore space is shown in grey. The image was generated using micro-CT scanning with a resolution of 10 μm. Three-dimensional image of the extracted pore network for the Berea central image (64 voxels)
The coordination number distribution of the network extracted from the Berea 64 voxel image compared to that generated by Øren and Bakke (2003) Properties of the network extracted for the Berea sample compared to results from Øren and Bakke [2003]
Comparison of the properties of the network extracted for all slices of the Berea 3D image Comparison with measured properties for the Berea sample
Network extraction from the carbonate 2D image 3D image of the extracted pore network for the carbonate image (60 voxels). A thin section image from subsurface Oman. The area highlighted in white is the portion used for network extraction (size of white area: 0.0718mm, image resolution is 1.2 μm). Coordination number distribution for the carbonate sample A 3D image of the carbonate sample, generated using multiple point statistics
Pore size distribution for the subsurface carbonate sample Network properties for the carbonate sample Comparison with measured properties for the carbonate sample Throat size distribution for the carbonate sample
Bar plot showing a comparison of the pore and throat sizes for the three samples: Fontainebleau, Berea and the Carbonate samples
Present work • Analysis of oil wet carbonate system using available capabilities: • Complete dataset • Core plugs with different experiments • Homogenous and heterogeneous core plugs • Leading into better estimation of recovery from transition zone
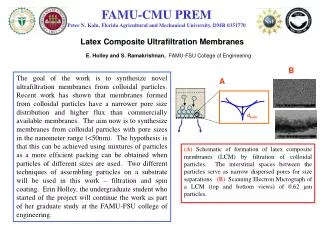
Plate A Plate B 209 mD 0.137 mD 0.428 mD 132 mD 1.043 mD 2.2 mm 0.5 mm Plate D Plate C 0.4 0.5 0.3 0.03 0.3 0.03 0.5 mm 0.1 mm
Proposed workflow: Capillary pressure and relative permeability predictions Network model generated too small for fluid flow calculations Use either Berea network model or regular lattice to generate large networks Berea network: max. coordination number 4 Regular lattice: max. coordination number 6 New: Centred cubic lattice: max. coordination number 14 Use connection number, porosity and throat size distribution from small network to predict drainage Pc for large network Use experimental wettability data (Amott index) and match to network by changing network contact angles to predict imbibition Pc, kro and krw behaviours
Predicting basic properties from the 11 images investigated Oil-wet carbonate sample: Used regular lattice model to generate a larger network assuming maximum coordination number of 6 Next test with Berea to study effect of real rock topography
Check basic static properties Oil recovery from transition zone √ done Check oil-wet behaviour whether it is reproducible in the network model Explore relationship: Soi - Sor √ done 1. Study effect of resolution 2. Study effect of different image parts at same resolution √ running Quantitative match: drainage capillary pressure Detailed match: Loop until match is reached √ running Change contact angles to match Amott index Static properties Quantitative match: imbibition capillary pressure, relative permeability behaviour, end points Wettability, Contact angles