Download
1 / 23
230 likes | 307 Vues
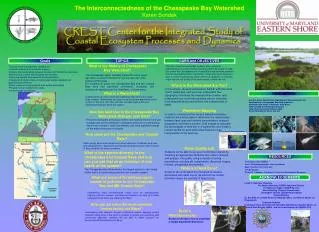
Discover the vulnerability of resource lands in the Chespeake Bay Watershed using an integrated modeling approach. Learn about the impact of urbanization and habitat loss, and how to prioritize conservation activities. The study area covers the Washington, DC-Baltimore region.

E N D
Notice: The views expressed here are those of the individual authors and may not necessarily reflect the views and policies of the United States Environmental Protection Agency (EPA). Scientists in EPA have prepared the EPA sections, and those sections have been reviewed in accordance with EPA’s peer and administrative review policies and approved for presentation and publication. The EPA contributed funding to the construction of this website but is not responsible for it's contents. Mention of trade names or commercial products does not constitute endorsement or recommendation for use.
Assessing the Vulnerability of Resource Lands in the Chesapeake Bay Watershed ReVA-MAIA Conference King of Prussia, PA May 13-15, 2003 Peter Claggett U.S. Geological Survey Chesapeake Bay Program Claire Jantz University of Maryland Department of Geography
What does “vulnerability” mean? • “Susceptible to physical or emotional injury” (Webster); • Combination of threat (exposure to stressors) and sensitivity (susceptibility to impairment)
Highly vulnerable resource Resource X High Resource Value Relating vulnerability to land conservation: X High X X X Conservation Priority! Sensitivity Low Threat High
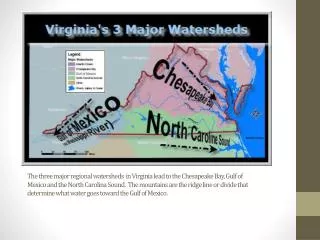
Vulnerability to what? “Habitat loss and degradation is a major problem throughout the Mid-Atlantic region. In the eastern half of the region, urban sprawl is contributing to this loss and degradation” ~ “What is the State of the Environment in the Mid-Atlantic Region?”, EPA-MAIA, 2001 (EPA/903/F-01/003) “If recent trends continue, the area of developed land in the (Bay) watershed will increase by more than 60% by 2030” ~ “Chesapeake Futures: Choices for the 21st Century”, STAC 2003.
Integrated modeling approach Theobald supply/demand/ allocation model • Supply: developable land • Demand: housing unit projections • Allocation and spread SLEUTH pattern based cellular automaton • Calibrated on historic patterns of urban land cover change • Forecasts patterns into the future
Integrating the Models • Overlay and aggregate modeling results to a grid of one square mile cells • Categorical classification of modeling results • Development potential = very high, high, moderate, or low • Combine the results from each model (threat map) • Overlay threat map on sensitive resource lands to prioritize conservation activities
SLEUTH modeling of impervious surfaces Mapped and modeled impervious surface 1990 mapped 2000 mapped 2010 modeled
Mapped Change in Impervious Surface (1990 - 2000) Modeled Change in Impervious Surface (2000 - 2010)
Theobald’s Accuracy: Housing Units Correlation coefficient: 0.85 R2 = 0.73 Y = 0.88x + 253.89 P < 0.001
Land consumption: # of housing units * lot size (1990 - 2000) Land consumption: # of housing units * lot size (2000 - 2010)
Determination of threat level Results from SLEUTH and Theobald divided into five classes using “natural breaks” method “Very high” = top 2 quintiles from both models “High” = top 2 quintiles from either model “Low” = bottom quintile from both models “Moderate” = all other combinations
Very High Low Sensitive Resource Lands Resource Lands
Conclusions • Combination of SLEUTH and Theobald models provide an adequate forecast of short-term, relative development potential (10-year timeframe) • Long-term forecasts (20+ years) require the incorporation of economic data and a better representation of growth rates and patterns • Incorporating lot size as a factor enables the exploration of low density growth and alternative future scenarios • Aggregating model output within a large overlay grid enables the combination of multi-temporal and multi-spatial scale data
Future Research • Validate analysis results • Include more data in assessment of mean lot sizes • Forecast long-term (20 – 30 year) urban, urbanizing, and rural growth rates and patterns, incorporating economic data and forecasts
Acknowledgements Resource Lands Assessment Technical Team, Chesapeake Bay Program Debbie Weller, Lynda Eisenberg, and Richard Hall, Maryland Office of Planning John Schlee and Katherine Nelson, Maryland National Capital Park and Planning Commission Portions of this research were funded by NASA grants NAG513397 and NAG1302010, principle investigator Dr. Scott Goetz, Woods Hole Research Center/University of Maryland
For more information about David Theobald’s supply/demand/allocation model • Western Futures Mapping: http://ndis.nrel.colostate.edu/davet/dev_patterns.htm • For more information about SLEUTH • USGS Gigalopolis website: http://www.ncgia.ucsb.edu/projects/gig/ • UMD RESAC implementation of SLEUTH in the Baltimore-Washington region: http://www.geog.umd.edu/resac/urban-modeling.htm