Derivatization Spectra of Peptides for Mass Spectrometry Analysis
Explore CAD spectra of peptides after derivatization with various reagents for mass spec analysis, showing fragmentation patterns and abundance peaks.

Derivatization Spectra of Peptides for Mass Spectrometry Analysis
E N D
Presentation Transcript
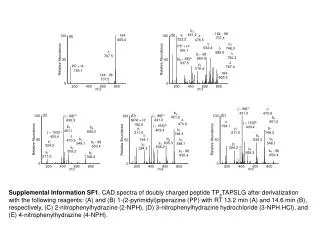
b4 451.2 - 164 805.4 (A) - 164 - 98 707.4 100 y1 222.2 (B) 476.5 100 632.4 b7 748.3 PP + H+ 165.1 689.5 787.5 730.3 b7 - 98 650.4 Relative Abundance 50 (y6 – 98)2+ 337.5 Relative Abundance 50 787.4 PP + H+ 165.1 y4 519.4 - 164 - 98 707.5 - 164 805.3 0 0 200 400 600 800 m/z 200 400 600 800 m/z (– 98)2+ 431.0 470.9 b4 451.2 (C) (E) (D) (– 98)2+ 431.0 (– 98)2+ 430.9 100 100 b4 451.2 100 470.9 NPH + H+ 152.0 194.1 (– 153)2+ 403.4 (– 153)2+ 403.4 b4 451.1 b6 635.3 b7 748.3 y1 211.0 y1 211.0 b7 748.3 (– 153)2+ 403.4 194.1 b6 635.3 470.9 b6 635.3 b5 548.1 b5 548.1 b5 548.1 Relative Abundance Relative Abundance y2 324.3 50 50 Relative Abundance 50 b7 - 98 650.4 y4 508.2 y2 324.3 y2 324.3 y4 508.2 y4 508.3 b7 - 98 650.4 b7 - 98 650.4 y1 211.0 b7 748.2 0 0 0 200 400 600 800 200 400 600 800 200 400 600 800 m/z m/z m/z Supplemental Information SF1. CAD spectra of doubly charged peptide TPpTAPSLG after derivatization with the following reagents: (A) and (B) 1-(2-pyrimidyl)piperazine (PP) with RT 13.2 min (A) and 14.6 min (B), respectively, (C) 2-nitrophenylhydrazine (2-NPH), (D) 3-nitrophenylhydrazine hydrochloride (3-NPH.HCl), and (E) 4-nitrophenylhydrazine (4-NPH).
(B) (– 98)2+ 430.9 100 – 98 860.5 (A) 100 730.4 y4 588.5 y5 659.4 b5 468.3 b7 748.4 Relative Abundance 50 632.5 Relative Abundance 50 b7 - 98 650.5 y4 588.2 b4 371.2 y6 760.4 y4 - 98 490.5 b7 748.2 y1 211.1 940.3 0 200 400 600 800 1000 0 m/z 300 500 700 900 1100 m/z Supplemental Information SF2. CAD spectra of singly (A) and doubly charged (B) peptide TPTAPpSLG after derivatization with 2-nitrophenylhydrazine (2-NPH).
– 153 945.6 (A) 100 b5 575.5 687.5 y4 671.5 y6 898.5 557.5 Relative Abundance 50 y5 785.6 927.7 y3 524.5 b7 832.5 b6 704.5 1081.5 y2 395.5 0 300 500 700 900 1100 m/z b72+ 417.1 b7 832.4 (B) 100 y6 898.4 (-153 - 28)2+ 459.7 y3 524.4 a2 173.2 250.3 y5 785.5 b5 575.4 (-153)2+ 473.6 b2 201.2 50 Relative Abundance 541.3 y2 395.4 558.3 b6 704.4 y1 267.2 y4 671.5 687.4 b3 314.3 815.4 0 200 400 600 800 1000 1200 m/z Supplemental Information SF3. CAD spectra of singly (A) and doubly charged (B) peptide SIINFEKL after derivatization with 2-nitrophenylhydrazine (2-NPH).
1128.5 (B) (A) (C) 100 100 100 b9 1135.5 y8 1180.5 b9 1000.4 y8 1045.5 b9 + 18 1018.4 b8 1034.4 b8 899.5 1199.6 Relative Abundance Relative Abundance 50 Relative Abundance 50 50 1263.5 y6 725.5 y6 860.5 y8 910.5 b9 1000.5 - 153 1128.5 707.5 b8 899.5 y6 995.5 1111.5 - 153 1263.6 b7 784.5 b7 784.5 b7 784.5 0 0 0 400 600 800 1000 1200 1400 400 600 800 1000 1200 1400 400 600 800 1000 1200 1400 m/z m/z m/z Supplemental Information SF4. CAD spectra of singly charged peptide VHGQPHQDTK: (A) without derivatization, (B) and (C) after derivatization with 2-nitrophenylhydrazine (2-NPH). (B) mono-NPHylation, (C) di-NPHylation.
(A) (-153)2+ 454.2 100 (B) (-153 - 28)2+ 440.5 (-153)2+ 454.1 100 b6 607.4 b6 607.5 b5 494.4 b5 495.4 b8 793.4 y4 566.3 389.2 y4 566.5 b08 - I 662.3 b08 - I 662.4 b8 793.5 521.4 775.5 b82+ 398.0 y2 366.8 775.4 b82+ 397.5 589.3 50 Relative Abundance 50 521.4 Relative Abundance b7 694.5 y1 267.2 b7 694.4 y1 267.5 589.5 388.7 676.4 676.7 250.3 250.6 757.5 757.4 y2 366.4 0 0 200 400 600 800 1000 200 400 600 800 1000 m/z m/z Supplemental Information SF5. CAD spectra of doubly charged peptide EHAGVISVL after derivatization with (A) 3-nitrophenylhydrazine hydrochloride (3-NPH.HCl) and (B) 4-nitrophenylhydrazine (2-NPH).
1041.5 906.6 (A) (B) 100 100 y7 658.7 676.7 757.4 b8 793.6 757.6 775.5 b6 607.7 50 50 Relative Abundance Relative Abundance b6 607.5 775.7 b7 694.7 b5 494.4 - 153 906.5 b8 793.5 b5 494.5 589.6 888.5 589.4 888.7 476.6 476.3 0 0 300 500 700 900 1100 300 500 700 900 1100 m/z m/z 1041.5 1041.5 (D) (C) 100 100 757.5 757.5 775.6 775.6 - 153 906.6 b6 607.5 50 Relative Abundance 50 Relative Abundance b6 607.5 - 153 906.6 b8 793.6 b5 494.4 b8 793.5 b5 494.4 888.6 888.6 589.4 589.5 476.4 476.4 0 0 300 500 700 900 1100 300 500 700 900 1100 m/z m/z Supplemental Information SF6. CAD spectra of singly charged peptide EHAGVISVL: (A) without derivatization, and after derivatization with (B) 2-nitrophenylhydrazine (2-NPH), (C) 3-nitrophenylhydrazine hydrochloride (3-NPH.HCl), and (D) 4-nitrophenylhydrazine (4-NPH).