Download
1 / 23
230 likes | 386 Vues
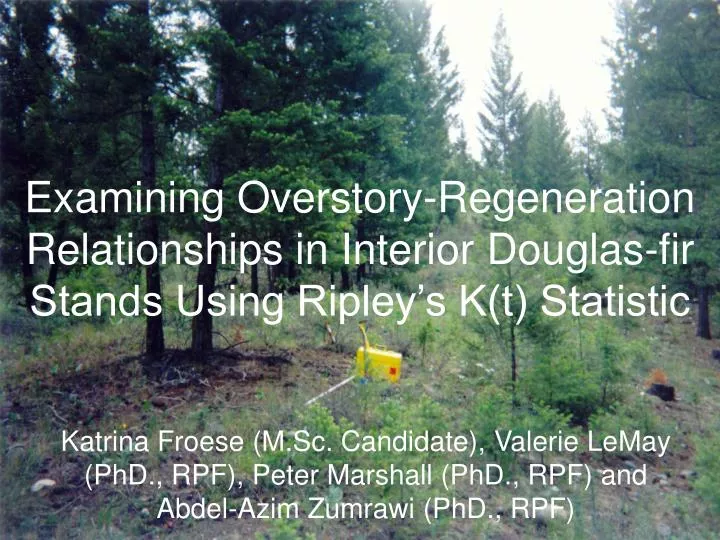
Examining Overstory-Regeneration Relationships in Interior Douglas-fir Stands Using Ripley’s K(t) Statistic. Katrina Froese (M.Sc. Candidate), Valerie LeMay (PhD., RPF), Peter Marshall (PhD., RPF) and Abdel-Azim Zumrawi (PhD., RPF). Background.

E N D
Examining Overstory-Regeneration Relationships in Interior Douglas-fir Stands Using Ripley’s K(t) Statistic Katrina Froese (M.Sc. Candidate), Valerie LeMay (PhD., RPF), Peter Marshall (PhD., RPF) and Abdel-Azim Zumrawi (PhD., RPF)
Background • Primary Objective: predict understory attributes (regeneration abundance, small tree height growth) based on stand level predictors and assess effectiveness • Secondary Objective: use spatial and substrate data to further examine understory dynamics • This Presentation: using point pattern analysis to examine relationship between overstory trees and loci of regeneration “clumps”
Study Area • IDFdm2, Invermere Forest District, Nelson Forest Region, southeastern British Columbia • Valley bottoms and lower slopes, Rocky Mountain Trench, 900-1200m elevation • Soil moisture deficit and frost important • Generally uneven aged stands, managed with partial cutting (some clearcuts)
Study Area • Stands are Douglas-fir (Pseudotsuga menziesii var. glauca) or Douglas-fir with: • ponderosa pine (Pinus ponderosa) • lodgepole pine (Pinus contorta var. latifolia) • western larch (Larix occidentalis) • hybrid white spruce (Picea glauca x Engelmannii ) • trembling aspen (Populus tremuloides) • paper birch (Betula papyrifera) • History of partial cutting and fire suppression (last 50-100 years)
Sampling Frame • All areas within the IDFdm2 study area disturbed within the last 5-25 years • Candidate openings selected from sampling matrix based on: • Number of years since disturbance • Silvicultural system • BEC site series • Elevation • Good geographic range of sites was obtained • North to south along trench • East to west
Sampling Design • One in four 11.28 m radius plots were spatially mapped (for a total of 25 plots) • Distance and bearing to: • Large trees (DBH, species) • Small trees (DBH, species) • Regeneration clumps (species, height class, length, width, axis) • Stumps (diameter at 0.15 m) • Windthrow (DBH, length, axis) • Large slash piles (as regen) • Large clumps of shrubs (as regen)
Point Pattern Analysis • Test observed spatial patterns vs. null hypothesis of underlying Poisson (random) process • Competition -> uniformity/regularity • Favourable sites -> clustering/aggregation • Spatial indices: single value for an area • Ripley’s K(t): relative randomness as a function of scale (distance) • Ripley’s K(t): uses all pairs of points, not just nearest neighbours
Methods • Ripley’s K(t) calculated for distance 0.5m to 11m by 0.5m intervals • Edge correction applied to account for unsampled trees outside boundary
Methods • Edge effect means that therefore • Result transformed to L(t), linearizing K(t) and providing expected value of zero under Poisson • L(t): difference between no. points found within point-pair radius and expected no. points
Methods • Univariate analyses: live+dead (initial overstory), live, and dead overstory trees (release) • Bivariate analyses: 3 types of overstories vs. advance+subsequent, advance, and subsequent regeneration clumps • Monte Carlo simulation of 90% confidence envelopes (univariate and bivariate analyses) • Assumptions (bivariate): • center of clump represents origin • overstory affects location of clumps (causal)
Plot 1 Initial BA: 40 m2/ha Current BA: 19 m2/ha BA Removal: 49 % Years Since Dist: 18 No. Clumps: 10 Avg. No. Stems: 39 Slope: 0 Aspect: 44 Moisture: 01/03 Elev: 903 m
Plot 2 Initial BA: 36 m2/ha Current BA: 10 m2/ha BA Removal: 70 % Years Since Dist: 11 No. Clumps: 18 Avg. No. Stems: 7 Slope: 28 Aspect: 248 Moisture: 03 Elev: 924 m
Plot 7 Initial BA: 38 m2/ha Current BA: 2 m2/ha BA Removal: 95 % Years Since Dist: 18 No. Clumps: 9 Avg. No. Stems: 5 Slope: 6 Aspect: 317 Moisture: 01 Elev: 1152 m
Results • Generally, overstory trees prior to harvesting and/or mortality exhibited significant clustering at short distances • Relationship between regeneration clumps and overstory (pre-mortality, live, and dead) was often significant but extremely variable • Variability in results was not easily explained by simple site level variables
Sources of Error • Mapping of stems at POG – lean, slope • Edge effect correction • Improper assumptions • Missing cause of variability • No error – testing wrong relationship
Conclusions • Replication essential - variability • Keep in mind what question you’re asking (e.g., causal factors) • Appropriate tool? • Clumps are not points • Need to be able to interpret results
Special Thanks to the world's best supervisor, Dr. Val LeMay Funding for this research provided by Forest Renewal BC and Forestry Innovation Investment.In-kind contributions were supplied by the BC Ministry of Forests, the University of BC Faculty of Forestry, Tembec Industries, Slocan Forest Products, and Riverside Forest Products.
References • Moeur, M. 1993. Characterizing spatial patterns of trees using stem-mapped data. For. Sci. 39(4): 756-775. • Moeur, M. 1991. Spatial Variation in Conifers Regenerating Beneath Old Growth Forest Canopies. Ph.D. Dissertation, University of Washington, College of For. Res., Seattle, WA. 301 p. • Nigh, G. 1996. Identification and simulation of the spatial pattern of juvenile lodgepole pine in the sub-boreal spruce biogeoclimatic zone, Stuart dry warm and Babine moist cold variants. BC Min. For. Res. Br., Victoria, BC. FRDA Rept. 244. 28 p. • Ripley, B.D. 1998. Statistical Inference for Spatial Processes. Cambridge Univ. Press, Cambridge. 148 p. • Ripley, B. D. 1977. Modelling spatial patterns. J. Royal Stat. Soc. B 39(2): 172-212. • Upton, G.J.G. and B. Fingleton. 1985. Spatial Data Analysis by Example, Vol. 1: Point Pattern and Quantitative Data. John Wiley & Sons, Chichester. 410 p.