Understanding Random Variables in Probability Theory: Deep Dive into Distributions & Variables
Explore random variables, probability distributions, properties, discrete vs. continuous variables, and more in this comprehensive guide. Learn about mean, variance, standard deviation, and probability histograms. Enhance your understanding of continuous random variables and the normal distribution. Master formulas for calculating the mean, variance, and standard deviation of random variables.


Understanding Random Variables in Probability Theory: Deep Dive into Distributions & Variables
E N D
Presentation Transcript
Random Variables Probability Continued Chapter 7
Random Variables • Suppose that each of three randomly selected customers purchasing a hot tub at a certain store chooses either an electric (E) or a gas (G) model. Assume that these customers make their choices independently of one another and that 40% of all customers select an electric model. The number among the three customers who purchase an electric hot tub is a random variable. What is the probability distribution?
Random Variable Example X = number of people who purchase electric hot tub X 0 1 2 3 .288 P(X) .216 .432 .064 (.6)(.6)(.6) GGG EEG GEE EGE (.4)(.4)(.6) (.6)(.4)(.4) (.4)(.6)(.4) EGG GEG GGE (.4)(.6)(.6) (.6)(.4)(.6) (.6)(.6)(.4) EEE (.4)(.4)(.4)
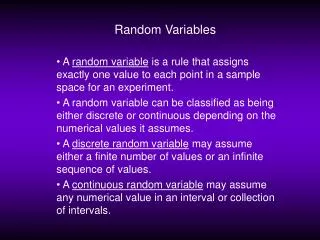
Random Variables • A numerical variable whose value depends on the outcome of a chance experiment is called a random variable. • discrete versus continuous
Discrete vs. Continuous • The number of desks in a classroom. • The fuel efficiency (mpg) of an automobile. • The distance that a person throws a baseball. • The number of questions asked during a statistics final exam.
Discrete versus Continuous Probability Distributions Which is which? • Properties: • For every possible x value, 0 < x < 1. • Sum of all possible probabilities add to 1. • Properties: • Often represented by a graph or function. • Area of domain is 1.
Probability Histograms • We can create a probability histogram to show the distributions of discrete random variables.
Example • Let X represent the sum of two dice. • Then the probability distribution of X is as follows:
Continuous Random Variable and Density Curves • The probability distribution of a continuous random variable assigns probabilities under a density curve. • Probabilities are assigned to INTERVALS of outcomes rather than to individual outcomes. • A probability of 0 is assigned to every individual outcome in a continuous probability distribution.
The Normal Distribution can be a Probability Distribution • The normal curve
Means and Variances • The mean value of a random variable X (written mx ) describes where the probability distribution of X is centered. • We often find the mean is not a possible value of X, so it can also be referred to as the “expected value.” • The standard deviation of a random variable X (written sx )describes variability in the probability distribution.
Mean of a Random Variable Example • Below is a distribution for number of visits to a dentist in one year. X = # of visits to the dentist. • Determine the expected value, variance and standard deviation.
Formulas Mean of a Random Variable Variance of a Random Variable
Mean of a Random Variable Example E(X) = 0(.1) + 1(.3) + 2(.4) + 3(.15) + 4(.05) = 1.75 visits to the dentist
Variance and Standard Deviation of a Random Variable Example Var(X) = (0 – 1.75)2(.1) + (1 – 1.75)2(.3) + (2 – 1.75)2(.4) + (3 – 1.75)2(.15) + (4 – 1.75)2(.05) = .9875