Understanding Population Pyramids and Demographic Transition Stages
This overview explores the stages of demographic transition through the analysis of population pyramids. It outlines the characteristics of each stage: Stage 1 (High Stationary) features high birth and death rates; Stage 2 (Early Expanding) sees a drop in death rates while birth rates remain high; Stage 3 (Late Expanding) marks a decline in birth rates; Stage 4 (Low Stationary) involves further declines in birth rates, leading to a stationary population; and Stage 5 potentially indicates declining population levels as death rates exceed birth rates.


Understanding Population Pyramids and Demographic Transition Stages
E N D
Presentation Transcript
Population Pyramids A visual demographic transition model
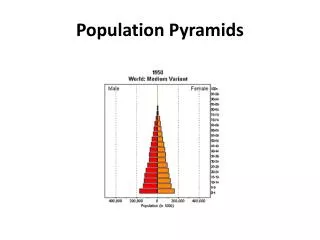
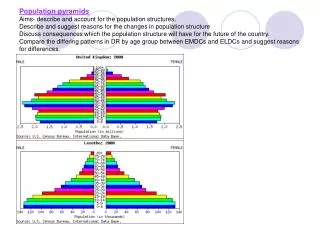
Dependency Load : 52.0 Working Population : 48.0 Dependency Ratio : 1.083 Stage 1??? of demographic transition (High Stationary)- The birth and death rate are elevated. Shown by the scooped form of the sides which indicates a large number of deaths from one cohort to the next.
Dependency Load : 44.5 Working Population : 55.5 Dependency Ratio : .802 Stage 2 of demographic transition (Early Expanding) – The birth rate remains elevated but the death rate has dropped. This is shown in the straightening of the sides of the pyramid.
Dependency Load : 37.8 Working Population : 62.2 Dependency Ratio : .608 Stage 3 of demographic transition (Late Expanding) – The birth rate follows the death rate and begins to drop. This is shown in the straightening of the base of the pyramid.
Dependency Load : 35.4 Working Population : 64.6 Dependency Ratio : .548 Stage 4 of demographic transition (Low Stationary) – The birth rate continues to drop and population levels become stationary. The base of the pyramid is pinched inwards and there are more and more older people.
Dependency Load : 31.5 Working Population : 68.5 Dependency Ratio : .459 Stage 5??? of demographic transition (Declining?) – The death rate exceeds the birth rate and population levels may begin to drop as natural decrease sets in.