ALMA Timeline
The Atacama Large Millimeter Array. ALMA Timeline. ALMA Specifications. ALMA Median Sensitivity (1 minute; AM=1.3; PWV= 1.5mm). Formation of Stars.

ALMA Timeline
E N D
Presentation Transcript
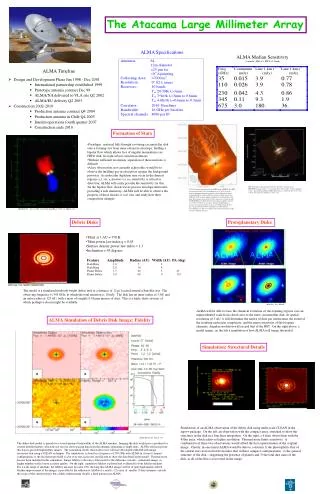
The Atacama Large Millimeter Array ALMA Timeline ALMA Specifications ALMA Median Sensitivity(1 minute; AM=1.3; PWV= 1.5mm) Formation of Stars • Paradigm: material falls through a rotating circumstellar disk onto a forming star from more extensive envelope, fuelling a bipolar flow which allows loss of angular momentum (see HH30 disk, far right at best current resolution). • Without sufficient resolution, separation of these motions is difficult • A key observation, not currently achievable, would be to observe the infalling gas in absorption against the background protostar. As molecular depletion may occur in the densest regions (c.f. NH3 in IRAM04191 at left) sensitivity is critical to detection; ALMA will easily provide the sensitivity for this. • In the bipolar flow, shock waves process envelope molecules, providing a rich chemistry--ALMA will be able to observe the progress of these shocks in real time and study how their composition changes. • Design and Development Phase Jun 1998 - Dec 2001 • International partnership established 1999 • Prototype antenna contract Dec 99 • ALMA/NA delivered to VLA site Q2 2002 • ALMA/EU delivery Q2 2003 • Construction 2002-2010 • Production antenna contract Q4 2004 • Production antenna in Chile Q4 2005 • Interim operations fourth quarter 2007 • Construction ends 2010 HH 30: Overlay of the integrated 13CO 2-1 emission (contours) on the HST/WFPC2 image (color). A cross marks the position of the 1.3 mm continuum source. Stapelfeldt and Padgett (2001) inWootten, A., ASP Conf. Ser. 235: Science with the Atacama Large Millimeter Array, 163. CO(2-1) contours superimposed on an HST image of HH 30. The HST observations in false colors (from Burrows et al. 1996) show the optical continuum emission tracing the reflected light in the flared circumstellar disk, together with the emission of bright atomic lines ([SII], Ha, [OI]), tracing a highly collimated jet, perpendicular to the disk. The contours represent the CO(2-1) emission, as observed with the IRAM Plateau de Bure interferometer with an angular resolution of 1.2”×0.7” by Gueth et al. in prep. Only the channel map at a velocity of 11 km/s is plotted (contours are 80 mJy/beam). It shows the conical molecular outflow emanating out of the disk and surrounding the jet. The cross indicates the position of the peak of the 1.3 mm continuum emission. IRAM04191. Green: NH3 (1,1) VLA; Red/Blud: 12CO 2-1 NRAO 12m Debris Disks Protoplanetary Disks • Tdust at 1 AU = 350 K • Tdust power law index q = 0.45 • Surface density power law index = 1.3 • Inclination = 45 degrees Feature Amplitude Radius (AU) Width (AU) PA (deg) Dark Ring 1.0 7 2 Dark Ring 2.0 16 4 Planet Debris 1.5 40 5 45 Planet Debris 3.0 60 9 155 The model is a simulated modestly-bright debris disk at a distance of 12 pc located around a Sun-like star. The observing frequency is 345 GHz, at which the total emission is 10 mJy. The disk has an inner radius at 3 AU and an outer radius at 125 AU, with a mass of roughly 0.4 lunar masses of dust. This is a fairly dusty system, of which perhaps a dozen might be available. Modeling: Lee Mundy ALMA will be able to trace the chemical evolution of star-forming regions over an unprecedented scale from cloud cores to the inner circumstellar disk. At spatial resolution of 5 AU, it will determine the nature of dust-gas interactions the extent of the resulting molecular complexity, and the major reservoirs of the biogenic elements. Angular resolution will exceed that of the HST. On the right above, a model image; on the left a simulation of how ALMA will image the model. ALMA Simulation of Debris Disk Image: Fidelity Simulation: Structural Details Simulations of an ALMA observation of the debris disk using multi-scale CLEAN in the aips++ package. On the left, an observation with the compact array, stretched to show the structures in the disk in a four hour integration. On the right, a 4 hour observation with the 450m array, which achieves higher resolution. Thermal noise limits sensitivity. A combination of these two observations would afford the best representation of the original image. Clearly, in one transit ALMA would be able to constrain 1) the photospheric flux of the central star (not resolved from inner dust in these compact configurations), 2) the general structure of the disk—suggesting the presence of planets and 3) the total dust mass of the disk, as all of the flux is recovered in the image. ALMA Memo No. 386 & 387 The debris disk model is spread over several primary beamwidths of the ALMA antenna. Imaging the disk would pose a problem for current interferometers, which do not recover short spacing data from the antennas operating as single units. ALMA will incorporate this data to provide high fidelity images. The simulation results shown above use software developed at IRAM with image reconstruction using a CLEAN technique. The simulations is done for a frequency of 230 GHz with ALMA in its most compact configuration, so the resolution provided is a bit over one arcsecond, insufficient to show the fine detail in the model. Thermal noise has not been included in this simulation. Image fidelity is the ratio of the model to the difference (model – simulated) image, so higher numbers reflect more accurate quality. On the right, cumulative fidelity is plotted and evaluated for four fidelity medians. For a wide range of medians, the fidelity measure lies near 100, showing that ALMA images will be of quite high quality indeed. Further improvement of the images is possible by the addition to ALMA of a small (~12) array of smaller (7-8m) antennas, outside the scope of the current project but a likely enhancement should a third partner join ALMA.