Download
1 / 33
390 likes | 1.14k Vues
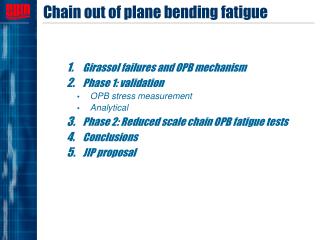
Chain out of plane bending fatigue. Girassol failures and OPB mechanism Phase 1: validation OPB stress measurement Analytical Phase 2: Reduced scale chain OPB fatigue tests Conclusions JIP proposal. 1 - Story of Girassol failure events. State of the art design

E N D
Chain out of plane bending fatigue • Girassol failures and OPB mechanism • Phase 1: validation • OPB stress measurement • Analytical • Phase 2: Reduced scale chain OPB fatigue tests • Conclusions • JIP proposal
1 - Story of Girassol failure events • State of the art design • Girassol chains designed according to conventional fatigue assessment using API RP2SK T-N curves • API fatigue life >60 years (3 x design life) • According to industry best practice in 2001 Girassol mooring should not have failed! • Girassol events • Several chains broken in ~ 8 months • Failure on link 5 • Bushing friction torque higher than interlink friction torque • Chain must bend before bushing rotates • =>New source of fatigue : Out of Plane Bending • SBM developed a methodology to assess performance of chains under this new fatigue mechanism
1 - OPB Failure mechanism • Tension fatigue is due to cyclic range of tension variations loading the chain. • OPB fatigue is due to range of interlink rotation under a certain tension. • Occurs predominantly in the first link after a link that is constrained against free rotational movement. • Failure can be fast. • Link Constraint provided by Chainhawse or Fairlead. Mechanism aggravated by high pretensions and is generating critical cyclic stress loading
Area of max stress in Out of Plane Bending MOPB Crack propagation 1 - Failure mechanism • Crack propagation initiated • at hot spot stress in bending • Crack initiation due to • corrosion pitting • Rupture in 235 days
r0 αint ri αi F N β T 1 - Interlinks locking modes • Bending stress: • Rolling • Sticking • Sliding:
1 - Interlinks contact area • Flat contact area generated by the proof load test (> 66% MBL) • This indentation area may encourage “sticking mode” / “rolling mode” • Finite Element plastic analysis at proof load Indentation area Girassol recovered link
2 – 1st test phase: OPB s measurement • SBM laboratory tests : measurement of bending • stresses in chains • Chain size (mm): 81, 107, 124, 146 • Tension : 20 t 94 t
2 - Experiments & analysis • Bending stress variation against interlink angle • Test campaign to measure OPB stress in “sticking” locking mode • Determine the influence of: • Tension • Diameter • Interlink angle • Derive an empirical law
2a– Quarter-Link Model Cases: • 94 ton tensile loading with zero friction • 94 ton tensile loading with μfriction=0.25, 0.5 • 60% CBL (878 ton) with μfriction=0.5 • 94 ton tensile loading wth μfriction=0.1 • 94 ton tensile load with OPB link forced sliding μfriction=0.3 FEA Details: • Elastic material with contact and friction • +/- 2° amplitude
2a– 3-Link Model Experimental setup for 124mm links
2a– 3-Link Model Nonlinear vs. Elastic 94 ton tensile loading, rig shoe 150 mm, μfriction=0.3, elastic 94 ton tensile loading, rig shoe 150 mm, μfriction=0.3, von-Mises
2a– 3-Link Model with Proof Loading 60% MBL preload, 94 ton tensile loading, rig shoe 150 mm, μfriction=0.3, von-Mises
2a– Link Intimacy Plastic Strains and Interlink Contact Intimacy for no-Preload vs. 80% CBL Preload 94 ton Load after 80% MBL 94 ton Load with no Preload
2 - Conclusion from the 1st test campaign • Better understanding of the OPB phenomena • Empirical relationship to predict OPB stress • Redesigned Chain connection • Predictions have been done on other mooring chain with surprising results. Although traditionally neglected, OPB fatigue damage can be significant. • Further tests are still undergoing to determine more accurately the OPB stress relationship.
3 – 2d test campaign: fatigue testing • Test program: • Monitoring of 40 mm chain links in 2 rescaled hawse (Girassol and Kuito) • Fatigue test with both hawses (in salt water) • Aim: • Investigate the interlink angle distribution in both hawses: influence of the chainhawse design • Validation of the stress relationship for smaller link Ø. • Obtain fatigue endurance data for OBP stresses
3 – Phase 2: fatigue test campaign • 2 Chainhawse type tested • Fatigue test results • Girassol design: • Kuito design: • Pitch A: 1 million of cycles: no failure • Pitch B: 1.3 million of cycles : no failure
3 - Girassol results • Angle variation function of the stroke • Propagation : p1 ≈ 80% for T=35t • Angle transmit by L4 larger than the induced hawse angle • Stress level at 35 t: • Total hawse angle variation: Datot ≈ 6.44° • Interlink angle variation on L5: Daint ≈ 4.9° • Bending stress range on L5: Ds max≈ 380 MPa • Note: s,NT ≈ 140 MPa
3 - Kuito results • Angle variation function of the stroke • Propagation : p1 ≈ 34% for T=35t • Stress level at 35 t: • Total hawse angle variation: Datot ≈ 2.70° • L2 Interlink angle variation: Daint ≈ 0.92° • L2 Mean stress range: Ds max≈ 280 MPa for T=35t
3 - Stress function of interlink angle • Kuito results • Pitch A, Pitch B in air and in seawater : quite good consistency • Stress relationship • Kuito chainhawse : slope at origin matches old relationship, then higher stresses • Girassol chainhawse: stress level in between theoretical rolling stress and locking stress
3 - Fatigue performance and S-N curve • Stresses • Maximum bending stresses are derived from measured stresses on link by multiplying by a SCF (1.08) • S-N curve • Straight chainhawse results: non failure • For high stress range, DNV in air mean curve gave a nice prediction • Corrosion pitting at the end of the test may not be representative from long term offshore corrosion • For lower stress ranges, the predictions may be too conservative Measured stress
4 - Conclusions • Stress relationship • The chainhawse geometry can affect the mode of interlink interaction • The curved chainhawse tend to concentrate the chain rotation to a single interlink angle rotation • The straight chainhawse tend to evenly spread out the chain rotation to several interlink angles • The curved chainhawse exhibit lower stress as a function of aint but aint a lot larger higher stresses than on the straight chainhawse • Previously obtained stress relationship function of aint • Matches initial slope for the straight chainhawse but then tend to underestimate the stresses • Overestimate the stresses for the curved chainhawse (rolling?) • S-N curve • Standard S-N curve seem to give conservative predictions • The trend seems to show a lower S-N curve slope (higher m value) compared to standard S-N curve • A link in bending experiences significant shear at the OPB peak stress need of specific S-N curve for similar loading conditions
5 - JIP proposal • FURTHER NEEDS: • Need OPB Stresses for higher tension levels (% MBL). • More endurance data for chain links subjected to OPB. • DELIVERABLES: • Improved Chain OPB stress relationships. • S-N curves to be used for OPB fatigue calculation. • RP • SCOPE OF WORK : • OPB stress measurements based on chain tests in the SBM laboratory (4 different chain size for 4 higher levels of tension). • Use FEA, in line with the work done by Chevron to calibrate the interlink stiffness and sliding threshold model by benchmarking tests results. • Develop a specific test rig for fatigue testing of chain-links in OPB. • S-N curve determination. • Develop RP for OPB fatigue prediction.
5 - JIP proposal • JIP value • Improve the safety of deepwater mooring systemsby providing a more accurate assessment method for OPB fatigue. • Added value: contribution of previous SBM and Chevron work (See 2005 OTC & 2006 OMAE papers) • Budget
Questions? • Please Contact SBM Monaco • Lucile Rampi • Lucile.rampi@singlebuoy.com • 00-33-92-05-86-24