Analyzing Gene Expression and Survival Rates Through Supplemental Figures
This document presents a comprehensive analysis of supplemental figures that detail gene expression and survival outcomes. The GeneChip 1.0 ST array is examined, highlighting the presence of multiple probes per gene and splicing information, though the details are inadequately described. Progression-free and overall survival rates are depicted over several months, providing crucial insights into patient outcomes. Figures include detailed graphical data on survival metrics that are essential for understanding disease progression and efficacy of treatments.

Analyzing Gene Expression and Survival Rates Through Supplemental Figures
E N D
Presentation Transcript
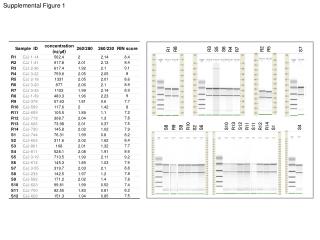
Supplemental Figure 1 R2 R5 R3 R1 R8 S6 R4 S5 R7 S7 R13 S12 R14 R10 R11 S11 R12 S10 R9 S4 S1 S8 S9 S6 S2
Supplemental Figure 3 • The GeneChip 1.0 ST array contains multiple probes per gene as well as information on splicing: none of this is properly detailed
Supplemental Figure 5 Progression-free survival Progression-free survival Progression-free survival Months Months Months
Supplemental Figure 6 Overall survival Overall survival Overall survival Months Months Months