Download
1 / 1
10 likes | 118 Vues
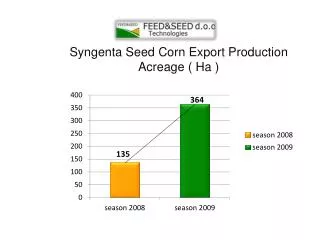
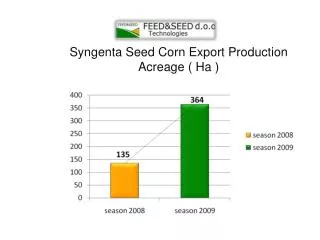
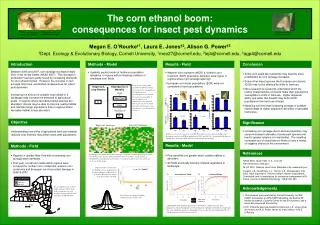
ECB. WCR. NCR. Insect Density Field -1. % Infested Fields. ln(# damaged plants). ln(rootworms card -1 week -1 ). % Infested Fields. * P = 0.03. * P = 0.02. high. high. low. low. low. high. High corn. Low corn.

E N D
ECB WCR NCR Insect Density Field-1 % Infested Fields ln(# damaged plants) ln(rootworms card-1 week-1) % Infested Fields *P = 0.03 *P = 0.02 high high low low low high High corn Low corn In each year of the model agricultural habitat patches are rotated, insect populations (N1) disperse, and reproduction occurs to form the next generation (N2)if insects land in corn. Simulations were initiated with 5 percent of corn fields infested with 50 insects each. Populations were followed for 20 years. Dispersal & Crop Rotation Reproduction & Mortality Death Non-Corn N1 2006, N=4 Corn Reproduction N2 2007, N=6 ‘Low corn’ landscape ‘High corn’ landscape Landscapes are modeled with three land-use categories: permanent perennial (green), agricultural-corn (beige), and agricultural-non corn (white). Crop rotation is simulated by redistributing agricultural-corn and agricultural-non corn patches in each year of the model. Marlin E. Rice Marlin E. Rice a) b) The corn ethanol boom: consequences for insect pest dynamics Western corn rootworm (Diabrotica virgifera) Northern corn rootworm (Diabrotica barberi) European corn borer(Ostrinia nubilalis) Megan E. O’Rourke†1, Laura E. Jones†2, Alison G. Power†3 †Dept. Ecology & Evolutionary Biology, Cornell University, 1meo27@cornell.edu, 2lej4@cornell.edu, 3agp4@cornell.edu Introduction Methods - Model Results - Field Conclusion Between 2006 and 2007, corn acreage increased nearly 20% in the United States (NASS 2007). This increase in production has been partly fueled by increasing demands for corn ethanol biofuel. However, the increase in corn acreage may have unintended consequences for insect pest dynamics. Increasing the amount of suitable crop habitat in a landscape may increase the densities of agricultural pests. In regions where favorable habitat patches are abundant, insects may be able to colonize nearby habitat and maintain larger populations than in regions where favorable habitat is less abundant. • Spatially explicit model of herbivore population dynamics in regions with contrasting numbers of simulated corn fields. • Western corn rootworm (WCR) & northern corn rootworm (NCR) population densities were higher in regions where corn acreage was high. • European corn borer populations (ECB) were not correlated to land-use patterns. • Some corn pests like rootworms may become more problematic as corn acreage increases. • Some other insect species like European corn borers (ECB) may not be affected by shifts in land-use. • More research is needed to understand which life history characteristics of insects make their populations susceptible to shifts in land-use. Higher dispersal ability and wider diet breadth may buffer ECB populations from land-use change. • Modeling confirms that increasing acreage of suitable habitat leads to higher population densities of specialist herbivores. Objective Significance • Increasing corn acreage due to biofuel production may cause increased outbreaks of some pest species and lead to greater reliance on insecticides. The resulting increased use of insecticides is likely to have a variety of negative effects on the environment • Understanding how shifts in agricultural land-use towards reduced crop diversity may affect insect pest populations Estimates of western corn rootworm (WCR), northern corn rootworm (NCR), and European corn borer (ECB) populations in 2006 and 2007 in contrasting landscapes in upstate New York with ‘high’ and ‘low’ amounts of corn acreage. Results - Model Methods - Field References • Pest densities are greater when suitable habitat is abundant. • All fields eventually become infested regardless of landscape. • Regions in upstate New York with contrasting corn acreage were identified. • First-year, non-Bt corn fields within regions were surveyed for northern corn rootworms, western corn rootworms and European corn borer plant damage in 2006 & 2007. NASS 2007. Quick Stats, U.S., Corn All. http://www.nass.usda.gov/. NLCD 2001. National Land Cover Database. http://www.mrlc.gov/ Qureshi, J.A., Buschman, L.L., Throne, J.E., Ramaswamy, S.B. 2005. Adult dispersal of Ostrinia nubilalis Hubner (Lepidoptera: Crambidae) and its implications for resistance management in Bt-maize. Journal of Applied Entomology. 129(6):281-292. Dispersal curve showing the probability of insects dispersing at various distances (Quereshi et al. 2005). Most insects remain near their natal corn field. y = a / (1 + 2a2bz)0.5 Insect sampling sites in 2007 within regions of New York with contrasting row crop acreage ranging from 10-30% of land area (NLCD 2001). Acknowledgements • This research was supported by Cornell University, an NSF IGERT traineeship, an EPA STAR fellowship, the Andrew W. Mellon foundation, Cornell’s Center for the Environment, and a Heinz Environmental Scholarship. • M.E. O’Rourke was responsible for field work, L.E. Jones wrote the model, and A.G. Power serves as major advisor to M.E. O’Rourke Insects have an equal probability of dispersing in any direction. a) Simulation of the numbers of pests per corn field in a ‘high’ and ‘low’ corn landscape scenario through time. b) Percentages of infested corn fields in a ‘high’ and ‘low’ corn landscape scenario. Simulations were run for 20 years beginning with 5% of fields infested with 50 insects per field.