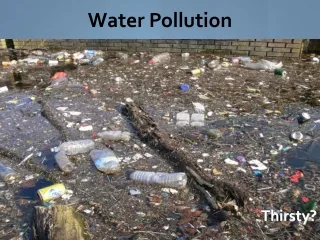
Water Pollution
Water Pollution. APES. Put name on water, put on back lab bench (by moose study habits poster) Get out types of pollutants handout Everything away except a writing utensil. WE HAVE TO START RIGHT AWAY! . APES. Get out graphs & water pollution notes. How to Collect Water Samples.

Water Pollution
E N D
Presentation Transcript
APES • Put name on water, put on back lab bench (by moose study habits poster) • Get out types of pollutants handout • Everything away except a writing utensil. WE HAVE TO START RIGHT AWAY!
APES • Get out graphs & water pollution notes
What is Water Pollution? • Change in water quality that can harm organisms or make water unfit for human uses • Contamination with chemicals • Excessive heat
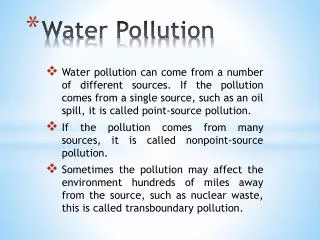
Sources of Water Pollution Point Source Nonpoint Source Broad, diffuse areas Difficult to identify & control Expensive to clean up Runoff Croplands Urban streets Feedlots Parking Lots • Located at specific places • Easy to identify, monitor & regulate - drain pipes - factories - sewage treatment - underground mines - oil tankers
Point Source of Polluted Water in Gargas, France Fig. 20-3, p. 530
Nonpoint Sediment from Unprotected Farmland Flows into Streams Fig. 20-4, p. 530
NONPOINT SOURCES Rural homes Cropland Urban streets Animal feedlot POINT SOURCES Suburban development Factory Wastewater treatment plant Point & Nonpoint Sources
Major Types of Pollutants • Sewage • Disease Agents • Sediment • Inorganic Plant & Algal Nutrients • Organic Compounds • Inorganic Compounds • Radioactives • Thermal Pollution Review Table 20.1!!
Major Types of Pollutants Turbidity: cloudiness or haziness of a fluid caused by suspended particles
Common Diseases Transmitted Through Contaminated Drinking Water
Leading Causes of Water Pollution • Agriculture activities • Sediment eroded from the lands • Fertilizers and pesticides • Bacteria from livestock and food processing wastes • Industrial facilities • Mining
Effects of YUCK water • The World Health Organization (WHO) • 1.6 million people die every year, mostly under the age of 5 • Diarrhea
How do we measure water quality? Presence or Absence of Harmful Pollutants Concentration of Harmful Pollutants Drinking water 0 colonies per 100 ml Swimming water 200 colonies per 100 ml HUMAN CONSUMPTION RECREATION Fecal Coliform Test
How do we measure water quality? • Measuring the level of Dissolved Oxygen (DO)
What is Dissolved Oxygen? • Amount of oxygen measured in water • Measured in milligrams per Liter (mg/L) OR parts per million (ppm) • mg/L = ppm
How do we measure water quality? • Using DO + BOD measurements • Using Coliform bacteria: Escherichia Coli tests • Using chemical analysis • Presence/Absence and concentration • Using indicator species • Macroinvertebrates
Dissolved Oxygen (DO) & Biological Oxygen Demand (BOD) • Dissolved Oxygen – Amount of oxygen dissolved in solution • BOD- rate at which organisms use up oxygen in water • The rate of oxygen consumption in a stream is affected by: temp., pH, microorganisms, type of organic/inorganic material in water
Point source Normal clean water organisms (Trout, perch, bass, mayfly, stonefly) Pollution- tolerant fishes (carp, gar) Fish absent, fungi, sludge worms, bacteria (anaerobic) Pollution- tolerant fishes (carp, gar) Normal clean water organisms (Trout, perch, bass, mayfly, stonefly) 8 ppm Types of organisms 8 ppm Dissolved oxygen (ppm) Biochemical oxygen demand Clean Zone Recovery Zone Septic Zone Decomposition Zone Clean Zone Fig. 20-7, p. 534
Why does dissolved oxygen decrease as biological oxygen demand increases? • Dissolved oxygen decreases when organic pollutants enter the water because bacteria uses the oxygen for decomposition.
Pollution of Lakes • Less effective at diluting pollutants • Stratified layers • Little to no flow
Pollution of Lakes • Slow Turnover • Flushing & changing of water temp. • Thermal Stratification • Little vertical mixing • Biological Magnification • Increase in the concentration of chemicals in organisms at successively higher trophic levels of a food chain • Eutrophication • Natural nutrient enrichment of lakes
Water 0.000002 ppm Phytoplankton 0.0025 ppm Herring gull 124 ppm Herring gull eggs 124 ppm Zooplankton 0.123ppm Lake trout 4.83 ppm Rainbow smelt 1.04 ppm Biomagnification
Cultural Eutrophication: Too Much of a Good Thing* Caused by runoff of plant nutrients - nitrates - phosphates
Eutrophic Lake Environmental Problems • excess nutrients enter water system • increases photosynthetic productivity • numbers of algae and cyanobacteria increase • water become cloudy (turbid) from population increase • populations die off and sink to bottom • become food for decomposers • decomposers BOD but DO in waters • fish die off • other species take root in nutrient rich sediments and begin to fill in waters
Eutrophic Lakes • Prevention • Remove nitrates & phosphates • Diversion of water • Clean Up • Remove excess weeds • Use herbicides & algaecides (downside? ) • Pump in air
Oligotrophic Lake • Low Nutrients • Clear Water • Small pop. of aquatic orgs.
Reducing Surface Water Pollution Nonpoint Source Point Sources Clean Water Act Water Quality Act • Reduce Runoff • Buffer Zone Vegetation • Reduce Soil Erosion
Groundwater Pollution • It can take hundreds to thousands of years for contaminated groundwater to cleanse itself of degradablewastes. • Nondegradable wastes (toxic lead, arsenic, fluoride) are there permanently. • Slowlydegradablewastes (DDT) are there for decades.
Groundwater Pollution • Source of drinking water • Common pollutants • Fertilizers & Pesticides • Gasoline • Organic Solvents • Pollutants dispersed in a widening plume • Pollutants fill porous rock, sand, bedrock, like water saturates a sponge
Leaking tank Aquifer Bedrock Water table Groundwater flow Free gasoline dissolves in groundwater (dissolved phase) Gasoline leakage plume (liquid phase) Migrating vapor phase Water well Contaminant plume moves with the groundwater Fig. 21-8, p. 502
Groundwater Cannot Cleanse Itself Very Well • Slow Flow: Contaminants not diluted • Less Dissolved Oxygen • Fewer decomposing bacteria • Low Temps.
Groundwater Pollution Sources Polluted air Hazardous waste injection well Pesticides and fertilizers Coal strip mine runoff Deicing road salt Buried gasoline and solvent tanks Cesspool, septic tank Pumping well Gasoline station Water pumping well Waste lagoon Sewer Landfill Leakage from faulty casing Accidental spills Discharge Freshwater aquifer Freshwater aquifer Freshwater aquifer Groundwater flow Fig. 20-13, p. 540
Pollution Prevention = Only Effective Way to Protect Groundwater! • Cleanup = expensive & time consuming
Groundwater Pollution PREVENTION • Monitoring aquifers • Leak detection systems • Use toxic chemical substitutes • Strict regulation – hazardous waste disposal • Storing hazardous wastes materials above ground
Water Pollution & Oceans • 2006: State of the Marine Environment • 80% of marine pollution originates on land • Sewage • Coastal areas most affected • Deeper ocean waters • Dilution • Dispersion • Degradation
Industry Nitrogen oxides from autos and smokestacks, toxic chemicals, and heavy metals in effluents flow into bays and estuaries. Cities Toxic metals and oil from streets and parking lots pollute waters; sewage adds nitrogen and phosphorus. Urban sprawl Bacteria and viruses from sewers and septic tanks contaminate shellfish beds and close beaches; runoff of fertilizer from lawns adds nitrogen and phosphorus. Construction sites Sediments are washed into waterways, choking fish and plants, clouding waters, and blocking sunlight. Farms Runoff of pesticides, manure, and fertilizers adds toxins and excess nitrogen and phosphorus. Red tides Excess nitrogen causes explosive growth of toxic microscopic algae, poisoning fish and marine mammals. Closed shellfish beds Closed beach Oxygen-depleted zone Toxic sediments Chemicals and toxic metals contaminate shellfish beds, kill spawning fish, and accumulate in the tissues of bottom feeders. Oxygen-depleted zone Sedimentation and algae overgrowth reduce sunlight, kill beneficial sea grasses, use up oxygen, and degrade habitat. Healthy zone Clear, oxygen-rich waters promote growth of plankton and sea grasses, and support fish. Fig. 20-16, p. 545
Water Pollution & Oceans • Cruise line pollution: what is being dumped? • U.S. coastal waters • Raw sewage • Sewage and agricultural runoff: NO3- and PO43- • Harmful algal blooms • Oxygen-depleted zones • Huge mass of plastic in North Pacific Ocean