Download

1 / 25
250 likes | 278 Vues
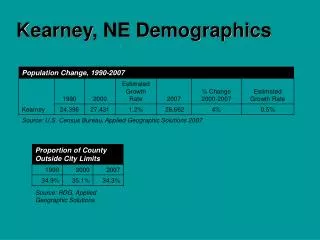
Explore national and Pennsylvania higher education enrollment data and projections up to 2016, with a focus on demographic shifts and PASSHE enrollment management goals. Highlighted are trends in high school graduates, enrollment transitions, and strategies for enrollment management.

E N D
Section VI: Pennsylvania Demographics State System of Higher Education, Census Data, and Data from ETS Pennsylvania Demographics & Trends and PASSHE Enrollment Management Planning (Source: Pennsylvania State System of Higher Education)
The actual and projected enrollment data and information presented on the following slides shows both national and Pennsylvania conditions for higher education enrollment planning to 2016. As a member of the PASSHE, Slippery Rock University supports the System’s enrollment management goals which are also provided here as a reference. National Higher Education Enrollments and High School Graduates – Projections State System Enrollments – Current and Historical Trends Demographics Transitions PASSHE Enrollment Management Goals & Issues Overview:
Pennsylvania Counties, Western vs. Eastern Erie Susque- hanna Warren McKean Bradford Potter Tioga Crawford Wayne Forest Wyoming Lacka-wanna Cameron Sullivan Elk Venango Lycoming Pike Mercer Clinton Clarion Luzerne Jeffer-son Colum-bia Monroe Mon- tour Law-rence Clearfield Union Carbon Butler Centre North- umber- land Armstrong North-ampton Snyder Schuylkill Beaver Indiana Juniata Lehigh Mifflin Cambria Dau- phin Allegheny Blair Leba-non Berks Perry Bucks Hunting-don Westmoreland Mont-gomery Washington Cumberland Lancaster Bedford Chester Somerset Fayette York Philadelphia Franklin Fulton Adams Greene Delaware
National Enrollments • From 2005 to 2013, the number of students in higher education is projected to increase from 16.3 to 17.8 million (8.7% increase). • The projected increase results from greater numbers of high school graduates and non-traditional students and higher participation rates in colleges and universities.
From 2004-05 to 2008-09, the number of students graduating from public and private high schools nationally is projected to increase from 2.97 to 3.18 million (7.1% increase). For Pennsylvania, the number expected to increase during that same time period is 3,995 (2.8% increase). High School Graduate – the boom years
Beginning in 2009 and continuing through 2014, the number of students graduating from high schools nationally is expected to decrease from 3.18 million to 3.04 million (4.4% decrease). For Pennsylvania, the decline will be steeper-the number decreasing during that same time period is 13,611 (9.3). National & Pennsylvania High School Graduates
Pennsylvania Projected Change in the Number of HS Graduates by County
Pennsylvania Projected Change in HS Graduates by County 2005 - 2009
Pennsylvania Projected Change in HS Graduates by County 2009-2016
From 2005-09, the top feeder counties will experience an increase in high school graduates of 2.7% (4.0% for eastern counties, -0.8% for western). From 2009-16, sixteen of the 20 top feeder counties will see a decrease in high school graduates. Overall the decrease is 9.8% (7.6% for eastern counties, 15.9% for western). Pennsylvania High School Graduates – Top Feeder Counties
Beginning in 2009-10, the projected number of high school graduates will begin a long decline. The percentage of decrease will be greater in western Pennsylvania counties. Of the 20 top recruiting counties, 14 are in the east. Demographic Transitions
We should expect increases in the freshman class through 2008-09 assuming that the System maintains its current share of Pennsylvania high school graduates. If the System decides to maintain the current size of the freshman class after 2011, we will need to increase market share and/or target other populations. Effects of Demographic Transitions
In order to manage projected decline of high school graduates beginning 2009-10, universities should review effectiveness of enrollment strategies. Strategies could include increased efforts to recruit transfers, non-residents, non-traditional students, students of color, and expansion of distance education enrollments. Enrollment Management
Increase Non-resident Students The number of 18-24 year olds in contiguous states is expected to increase by 11.6% from 5.1 million in 2000 to 5.7 million in 2015. Non-resident enrollment will become increasingly important for System Universities. PASSHE Enrollment Management Strategy
Increase Retention Strategy Enrollment strategies may also include increasing student retention (slowly increasing System-wide). Retention rates are positively correlated with SAT scores, and the System SAT average has been improving with each cohort since 1999. Universities will need to continue or expand interventions and programs that improve retention (e.g. advising, mentoring, counseling, freshman seminars). Enrollment Management Strategy
Increase Non-traditional Students Enrollment strategies may also include increasing the number of non-traditional students. Increase Distance Education Students Enrollment strategies may also include increasing the number of distance education students (e.g. taught by video, web-based, correspondence, etc.). Increase Diversity Enrollment strategies may also include increasing the number of students of color. Recruit more effectively in southeast counties and Erie and Allegheny counties PASSHE Enrollment Management Strategy
Meeting Pennsylvania Workforce Needs To support Pennsylvania workforce needs, the System has a goal of increasing graduates in high-need areas such as health care, science and technology. The greatest need for graduates in the Commonwealth is in health care fields. PASSHE Enrollment Management Strategies
National Enrollments – Projected growth from 2005 to 2013 (8.7%). Pennsylvania enrollments will continue to increase to 2009. Demographic Transition – Number of Pennsylvania high school graduates projected to peak in 2009, then decline fro a number of years thereafter. Competition will intensify among colleges and Universities recruiting fewer high school graduates after 2009. Demographic Summary