Download
1 / 57
570 likes | 813 Vues
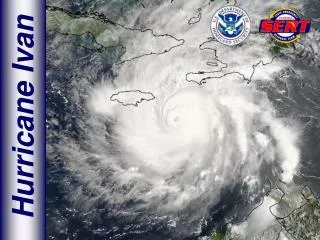
HAZUS and Hurricane Ivan. Model predictions and measured wind speeds Greg Gaston Ph.D. gggaston@una.edu Associate Professor Geography Department University of North Alabama Training and Travel supported by a Research Grant from the UNA College of Science.

E N D
HAZUS and Hurricane Ivan Model predictions and measured wind speeds Greg Gaston Ph.D. gggaston@una.edu Associate Professor Geography Department University of North Alabama Training and Travel supported by a Research Grant from the UNA College of Science
100,000 years of simulated storms...extrapolated from historic storm tracks
Hurricanes in the Atlantic Basin: 1851-2004 http://www.aoml.noaa.gov/hrd/tcfaq/E11.html
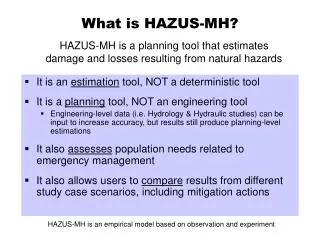
What is HAZUS? • GIS-based software tools (ArcGIS) • Loss estimation software that estimates physical damage from earthquakes, hurricanes, and floods • Available from FEMA free of charge (www.fema.gov/hazus)
Why HAZUS? • Earthquakes, floods, and hurricanes generate billions of dollars in losses • Knowing potential losses: • Enables better planning • Allows for improved infrastructure to protect people and reduce economic losses • HAZUS can estimate potential future losses
Damage estimation/responseand planning • The Federal Emergency Management Agency (FEMA) has spent over $40 million developing and improving a model for damage prediction in the built environment • Originally, only used for earthquake damage, the HAZUS MH has been expanded to include multiple hazards (hurricane winds and flooding)
Earthquake Flood Hurricane HAZUS-MH Loss Estimation Methodology
D e s i g n P e a k G u s t H u r r i c a n e W i n d S p e e d s ( m p h ) I n O p e n T e r r a i n 9 0 - 1 0 0 1 0 0 - 1 1 0 1 1 0 - 1 2 0 1 2 0 - 1 3 0 1 3 0 - 1 4 0 1 4 0 - 1 5 0 0 1 5 0 - 1 6 Hurricane Model - Hazard • Track model for storms affecting the Gulf and Atlantic coasts, and Hawaii • Hurricane wind field model developed with NSF funding • Regional mappings of land-use to surface roughness
Hurricane Hazard Model • Storms initiated in: • Atlantic • Caribbean • Gulf of Mexico • Eastern Pacific • Central Pacific • Storm curvature • Multiple land falls • Changes in intensity • design wind speeds in ASCE-7-98
Wind Field Model • Solves full non-linear equations of motion for translating hurricane; then establishes parameters for fast running simulation • Storm asymmetries • Changing sea-surface roughness • Air-sea temperature difference • Translation speeds
Hurricane Model – Building Classification • Building components determine degree of damage • 1,884 building classes • Building Type • Number of stories • Roof Straps • Wall Construction • Roof Covering • Etc.
±70% ±10% Example: Sensitivity to Wind Speed
User Defined (Single Storm) Scenario Type • 3 options: • Define manually • Import from exported file (other HAZUS users) • Import storm advisory from the Hurrevac FTP site
Questions and Assumptions • How well does HAZUS predict peak wind gusts from a hurricane as it tracks inland? • Working Assumption: As the HAZUS model integrates accepted NOAA hurricane models (Hurwind, Hursim). The accuracy of the wind predictions will be highest very near landfall. Accuracy will degrade as the storm tracks inland.
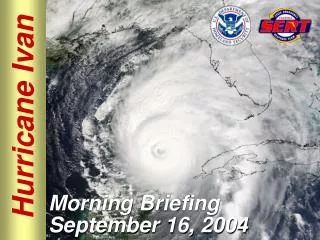
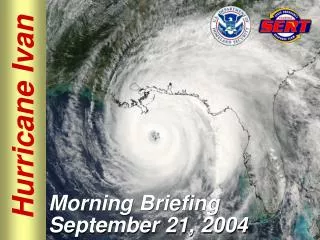
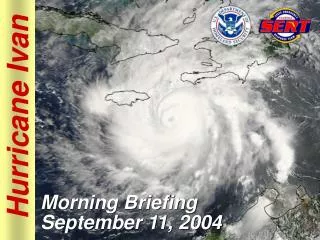
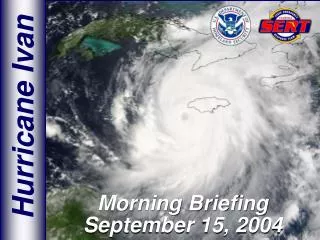
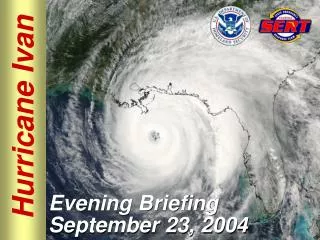
Limitations and Caveats • Ivan (2004) is the only hurricane examined (for this presentation) • Peak Wind gust data from Alabama stations • Data were taken from NOAA’s National Hurricane Center http://www.nhc.noaa.gov/2004ivan.shtml
Mesonet Data Stations Regional Airport Weather Stations (ASOS)
Spatial locations... • Spatial location data for each reporting station was collected either from Auburn University (Mesonet stations) or from the AirNav website for ASOS sites.
Ivan’s Actual Track... Re-formed and back into Texas
Size of the circle at each station indicates the magnitude of the difference between the model prediction and the observed wind speeds
Magnitude of difference between model prediction and station records and distance from the coast.
% Difference between model predictions and observed peak gusts. Color bands indicate 50 mile increments from the coast.
Distance Number of stations Average Error
Analysis and General Observations: • From these data HAZUS model over-estimates wind speed. • Stations closer to the coast have a greater over-estimation. • At distances 200-300 miles inland, the agreement between the model and actual values is very high. • In the case of Ivan, the model results are in many cases twice as high as the actual winds measured.
Is Ivan a special case? Does the HAZUS model accurately predict damage/loss in spite of over estimating wind velocity?
Peak Wind Gusts Final Hurrevac track (red line) Black line... Final corrected track
“... Final Corrected Track...” • By using the parameters contained in the NWS forecast advisory with no modification, HAZUS overestimates wind velocity. • An experimental NWS model H*wind provides a better solution
Final Corrected track uses H*WIND landfall parameters and NHC track coupled with surface wind speed and pressure measurements from C-MAN stations, Buoys, ASOS and FCMP tower data
Model results from the “Final Corrected Track” released just after landfall... Much higher accuracy