Pharmacokinetic introduction
Pharmacokinetic introduction. Based on A First Course in Pharmacokinetics and Biopharmaceutics by David Bourne, College of Pharmacy, University of Oklahoma.


Pharmacokinetic introduction
E N D
Presentation Transcript
Pharmacokinetic introduction Based on A First Course in Pharmacokinetics and Biopharmaceutics by David Bourne, College of Pharmacy, University of Oklahoma
A young child given an im injection might ask "How will that 'ouch' get from there to my sore throat"? The answer to this question is the basis of pharmacokinetics. That is, how drugs move around the body and how quickly this movement occurs. Many of the processes which control the absorption, distribution, metabolism, and excretion of drugs will be discussed.
Complex picture of drug interactions in the body. This slide gives an idea of the complexity of drug disposition. Shown in this slide are many of the steps to getting drug from one site in the body to another. Many of these processes are enzyme induced. However the overall picture often is much simpler. Many of these processes maybe fast or not significant for any given drug.
Processes involved in drug transport. Here the major processes are represented in a less physiological fashion. It is with this approach that we will look at much of the course material. The headings Absorption, Distribution, Metabolism, and Excretion are important
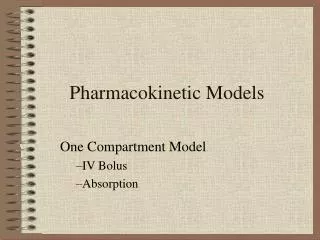
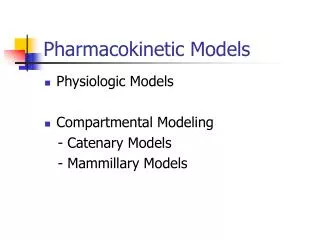
One, two, and three compartment pharmacokinetic models. Fortunately many of the processes involved in drug movement around the body are not saturated at normal therapeutic dose levels. The pharmacokinetic - mathematical models that can be used to describe plasma concentration as a function of time can then be much simplified. The body may even be represented as a single compartment or container for some drugs. For other drugs a two or three compartment model is found to be necessary.
Body before and after a rapid I.V. bolus injection, considering the body to behave as a single compartment. In order to simplify the mathematics it is often possible to assume that a drug given by rapid intravenous injection, a bolus, is rapidly mixed. This slide represents the uniformly mixed drug very shortly after administration.
Oral curve and beakers. We can picture oral administration as water flowing from one bucket (representing the GI tract) into a second beaker (representing the body). At first drug flows into the 'body' beaker and the level rises, as drug concentration rises, then after peaking the levels start to fall as elimination overtakes absorption.
Intravenous bolus injection with a two compartment model. Often a one compartment model is not sufficient to represent the pharmacokinetics of a drug. A two compartment model often has wider application. Here we consider the body is a central compartment with rapid mixing and a peripheral compartment with slower distribution. The central compartment is uniformly mixed very shortly after drug administration, whereas it takes some time for the peripheral compartment to reach a pseudo equilibrium.
A diagram of a two compartment model showing the parameters to be measured. The processes of distribution and excretion can be represented by the rate constants k12, k21, and k13. The rate constant k0 representing an infusion or absorption process. The drug appears to be dissolved in the body volume. This volume is the 'apparent' volume of distribution.
Effect as a function of time. From a graph such as this we can see the relationship between drug concentration and drug effect. If a drug has to reach an effective concentration at a receptor site this will be reflected as a required blood concentration.
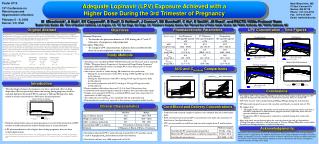
Biopharmaceutic parameters over a blood time curve. This slide shows some of the biopharmaceutic parameters which can be used to measure drug product performance. Later in the semester we will use the trapezoidal method of calculating AUC.
The four pharmacokinetic processes. We will briefly consider each of these processes in turn. A(bsorption) D(istribution) M(etabolism) E(xcretion).
A model with the various routes of administration. Later we will discuss different routes of administration and see how these effect the kinetics of drug disposition. For example absorption through the lining of the mouth, buccal absorption, often results in rapid absorption without the drug passing through the liver where it can be broken down. However, only low dose drugs can be accommodated by this ROA. Orally absorbed drugs are absorbed in the stomach or intestines and enter the portal blood supply and go to the liver before getting into the central blood supply. This can result in extensive metabolism of the drug before it can take any action. For this reason some drugs are very inefficient when given orally.
The processes involved in the dissolution of a tablet before absorption. A drug cannot be absorbed across the intestinal wall as a solid. It must first dissolve in the fluid of the G-I tract. Tablets are carefully formulated, designed, to stay together in the bottle during transport but break up quickly once they are in an aqueous environment. This can be an easy or difficult job depending on the drug and the dose required. There are therefore dissolution tests specified to ensure that tablet formulations work. Also it may be appropriate to conduct experiments with human volunteers to ensure that the tablet does release the drug as it should.
Plasma phenactin versus time curve after various suspensions (redrawn from Prescott, L.F., Steel, R.F., and Ferrier, W.R. 1970 Pharmacol. Ther., 11, 496-504). The effect of particle size on drug absorption is shown in this slide. Generally speaking the smaller the particle size the quicker the absorption. By increasing the particle surface area it is possible to increase the dissolution rate. However very small particle can clump together. Therefore a wetting agent such as Tween 80 can have a beneficial effect on the overall absorption. The intestinal fluids usually contain some materials which can act as wetting agents, however drug dissolution testing in vitro may neglect this effect.
Plasma penicillin concentration versus time curve after oral administration of various salts (redrawn from Juncher, H. and Raaschou, F. 1957 The solubility of oral preparations of penicillin V, Antibiot. Med. Clin. Therap., 4, 497). The rate at which a drug dissolves is dependent on the solubility of the drug. A common occurrence is that different salts will have quite different solubility characteristics, and again somewhat different to the free acid (or base) form. In the case of penicillin V it appears that only drug which is dissolved quickly can be absorbed.
Blood sugar levels after tolbutamide acid and salt (redrawn from Wagner, J.G. 1961 Biopharmaceutics: absorption aspects, J. Pharm. Sci., 50, 359. Rapid dissolution and absorption is not always the objective. Sometimes a slower release is required. In the case of tolbutamide, used to lower blood sugar concentrations, a more sustained release is better causing a more gradual reduction in blood sugar.
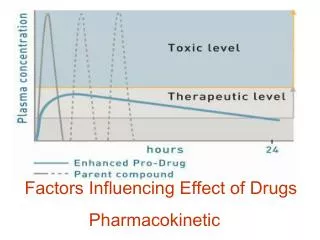
Plasma concentration time curves for three theoretical formulations with different ka values. The plasma concentrations achieved can be controlled by the rate of drug absorption. As shown product I would be toxic. A smaller dose, or a slower formulation should be considered. Formulation II appears to be effective in the dose and formulation used. The dosage form III appears to be too slow and thereby ineffective. If it is a drug requiring a sustained effect this formulation may be more useful at a higher dose or after repeated doses.
A young patient might ask "How does the medicine know where to go". Drug is distributed throughout the body directed by the physicochemical properties of the drug and the physiology of the body. Once the drug is absorbed what happens to it? The processes of excretion, metabolism, and distribution then take over to move the drug through and out of the body. Drug is distributed throughout the body depending on the physicochemical properties of the drug and the physiological properties of the body membranes and fluids.
The four processes schematically. Leading to the next process elimination.
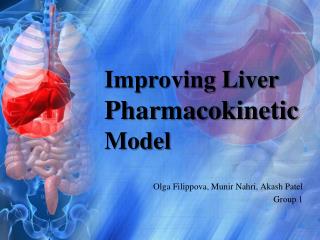
Methods of drug elimination, metabolism and excretion. The next topic is excretion. Drugs are eliminated by a number of processes. Polar drugs are easily filtered from the blood in the kidneys and removed into urine. However non polar material is generally reabsorbed from the kidney or distributed into fat tissue. The liver however is capable of metabolizing many drugs, generally producing compounds which are more polar and more easily excreted. Enzymes in the liver are able to form conjugates with drugs or hydrolyze and oxidize drugs. Drug kinetics can be markedly altered by changes in metabolism or excretion of drugs. These processes together result in the elimination of a drug.
Multiple dose curves with slow, medium, and fast excretion. Alteration of drug elimination is particularly important when drugs are given repeatedly. If it is assumed that the drug is eliminated normally when in fact it is slowly eliminated, drug accumulation may occur with toxic concentrations reached. Alternately faster elimination than expected may cause sub therapeutic concentrations to be reached.
A clinical example with kanamycin, showing theoretical curve after multiple dose and a better curve after dose adjustment. Kanamycin is a useful drug but it can cause some serious side effects. By controlling the blood concentration of this drug it is possible to use it effectively. In the case of patients with impaired renal, or kidney, function it is possible to determine the kidney function ahead of time and adjust the kanamycin dosing schedule accordingly.
Relationship between kanamycin half-life and serum creatinine level. As kidney function is reduced the serum creatinine level increases and the also the kanamycin takes longer to be eliminated from the body.
Extra absorption of salicylamide at higher doses. (redrawn from Barr, W.H. Drug Info. Bull., p27, 1969). Normally the amount of drug present in the body is no more than the enzymes can handle easily. Metabolism then proceeds in apparent first order fashion. However for some drugs the enzymes can not keep up. Illustrated here is one example, saturation of first pass metabolism allowing more or a higher fraction of drug to be absorbed.
Aspirin plasma concentration as a function of time (redrawn from Levy, G. 1965 J. Pharm. Sci., 54, 959). At higher doses the metabolism of aspirin is reduced by saturation. The elimination rate constant (as represented by the slope) is reduced.
Pentobarbital plasma concentration versus time illustrating the multiphasic distribution pattern (redrawn from Smith, R.B., Dittert, L.W., Griffen, W.O., and Doluisio, J.T. 1973 J. Pharmacokin. Biopharm., 1, 5). From a plasma concentration time curve it may appear that this drug is rapidly eliminated from the body. Actually little of the drug is eliminated with much of it being distributed in various tissues of the body. Here distribution is a major factor affecting the overall kinetics of this drug. By looking further we can see the real picture.
Pentobarbital concentrations in various tissues (redrawn from Bischoff, K.B. And Dedrick, R.L. 1968 J. Pharm. Sci., 57, 1347-1357). This illustrates the slow distribution of some drugs into and out of various tissues. Brain and other rapidly perfused tissues rapidly lose drug while other tissues are building up drug concentrations. Eventually significant amounts of drug will be collected in fat tissue from which it may only slowly be removed.
Other distribution mechanisms. Methods by which drug is kept in the body for extended action. pH, protein binding and fat storage are three major processes by which drug may be kept within the body. These are mechanisms by which drugs can be distributed throughout the body, protected from elimination, and cause a more prolonged activity.
"One for man. Two for a horse". There are many processes controlling drug disposition. Therefore dose adjustment is often necessary to produce the desired response from the patient. We will talk about the equations needed to calculate appropriate doses and the factors which can influence the plasma concentration of various drugs. In the next session we will start to look at the mathematics associated with a one and two compartment pharmacokinetic models...