Download
1 / 25
250 likes | 469 Vues
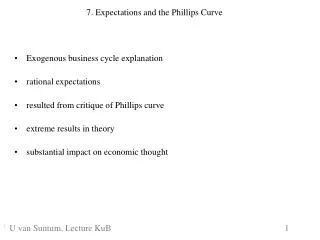
New Keynesian Open Economy Phillips Curve. Razin and Yuen. Firm’s Optimization:. Nominal. Real. Flexible prices. Set price one period in advance. ONE-PERIOD NOMINAL RIDIGITY. Steady state:. The Phillips Curve. ‘where. Elasticity of marginal product of labor wrt output.

E N D
New Keynesian Open Economy Phillips Curve Razin and Yuen
Firm’s Optimization: Nominal Real
Flexible prices Set price one period in advance
‘where Elasticity of marginal product of labor wrt output Elasticity of wage demands, wrt to output, holding marginal utility of income constant
Log-linearization of real mc: Partial-equilibrium relationship?
Closing the capital account: Closing the trade account:
Sacrifice Ratios in Closed vs. Open Economies: An Empirical Test Prakash Loungani, Assaf Razin, and Chi-Wa Yuen
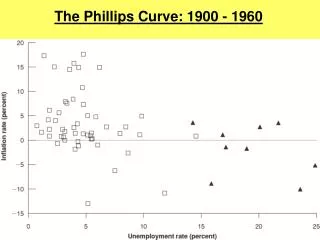
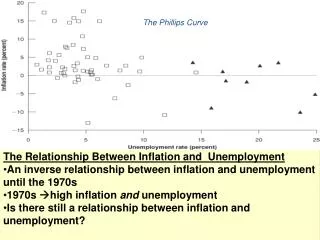
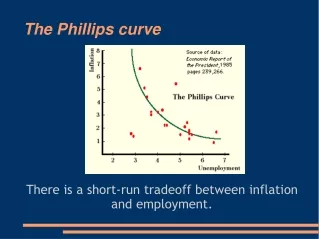
Background Lucas (1973) proposed a model in which the effect arises because agents in the economy are unable to distinguish perfectly between aggregate and idiosyncratic shocks; he tested this model at the aggregate level by showing that the Phillips curve is steeper in countries with more variable aggregate demand. Ball, Mankiw and Romer (1988) showed that sticky price Keynesian models predict that the Phillips curve should be steeper in countries with higher average rates of inflation and that this prediction too receives empirical support
DATA The data used in the regressions reported in this paper are taken from Ball (1993, 1994) and Quinn (1997). Sacrifice ratios and their determinants: Our regressions focus on explaining the determinants of sacrifice ratios as measured by Ball. He starts out by identifying disinflations, episodes in which the trend inflation rate fell substantially. Ball identifies 65 disinflation episodes in 19 OECD countries over the period 1960 to 1987. For each of these episodes he calculates the associated sacrifice ratio. The denominator of the sacrifice ratio is the change in trend inflation over an episode. The numerator is the sum of output losses, the deviations between output and its trend (“full employment”) level.
Sacrifice ratios and their determinants: Our regressions focus on explaining the determinants of sacrifice ratios as measured by Ball. He starts out by identifying disinflations, episodes in which the trend inflation rate fell substantially. Ball identifies 65 disinflation episodes in 19 OECD countries over the period 1960 to 1987. For each of these episodes he calculates the associated sacrifice ratio. The denominator of the sacrifice ratio is the change in trend inflation over an episode. The numerator is the sum of output losses, the deviations between output and its trend (“full employment”) level.
For each disinflation episode identified by Ball, we use as an independent variable the current account and capital account restrictions that were in place the year before the start of the episode. This at least makes the restrictions pre-determined with respect to the sacrifice ratios, though of course not necessarily exogenous.
Capital Flow Restrictions Quinn (1997) takes the basic IMF qualitative descriptions on the presence of restrictions and translates them into a quantitative measure of restrictions using certain coding rules. This translation provides a measure of the intensity of restrictions on current account transactions on a (0,8) scale and restrictions on capital account transactions on a (0,4) scale; in both cases, a higher number indicates fewer restrictions. We use the Quinn measures, labeled CURRENT and CAPITAL, respectively, as our measures of restrictions.
Conclusion In our earlier work we showed that restrictions of capital account transactions were significant determinants of the slope of the Phillips curve, as measured in the studies of Lucas (1973), Ball-Mankiw-Romer (1998), and others. The findings of this note lend support to this line of work, in particular to the open economy new Keynesian Phillips curve developed in Razin and Yuen (2001). We find that sacrifice ratios measured from disinflation episodes depend on the degree on restrictions on the current account and capital account. Of course, to be more convincing this finding will have to survive a battery of robustness checks, such as sub-sample stability, inclusion of many other possible determinants (such as central bank independence) in the regressions, and using instruments to allow for the possible endogeneity of the measures of openness.