Download
1 / 44
440 likes | 532 Vues
Learn the basics of epidemiology, vital statistics, and health indicators to assess community health status and prioritize health problems. Discover how to calculate mortality rates, case fatality rates, and study designs.

E N D
Introduction to Epidemiology Definitions and vital statistics
Definition “the study of the distribution and determinants of Health related states of events in specified populations, and the application of this study to control of health problems”
POPULATION Studies/Assessments Prevention Evaluation Planning INDIVIDUALS Diagnosis Treatment Curing Caring Relationship between Epidemiology and Clinical medicine
Descriptive & Analytical Epidemiology • Descriptive Epidemiology provides the WHO, WHAT, WHEN, and WHERE of Health related events in a population. • Analytic Epidemiology attempts to provide the WHY and HOW of Health related events in a population.
How Healthy is the Community? • Indicators are required to measure the health status of a community, compare health status of one community with another one, for assessment of health care needs, for monitoring and evaluation of services
What is an Indicator? • Indicators are defined as variables which help to measure changes.
Characteristics of an Indicator • Should be VALID • Should actually measure what they are supposed to measure • SHOULD BE RELIABLE • Should give the same results if repeated • SHOULD BE SENSITIVE • Should be sensitive to changes in the situation concerned • SHOULD BE SPECIFIC • Should reflect changes only in the situation concerned
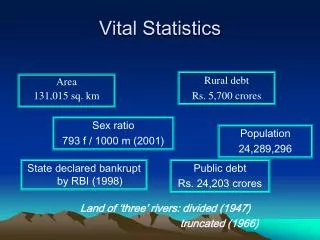
VITAL STATISTICS • These are health indicators of a society which are related to morbidity and mortality conditions of a society and reflect the true picture of health status of that society.
MORTALITY INDICATORS • Crude Death Rate • Number of deaths per 1000 population per year in a given community. Not a good indicator to assess the health status of a community because it does not show which age or sex group is having the maximum mortality.
How to overcome this problem? • AGE ADJUSTMENT
An example of Age AdjustmentComparison of Total Death Rates in populations Of Pakistan and Sweden
An example of Age AdjustmentComparison of Age-specific Death Rates in populations Of Pakistan and Sweden
An example of Age AdjustmentCarrying out Age adjustment using total of 2 populations of Pakistan and Sweden
Life Expectancy at Birth • The average number of years that will be lived by those born alive into a population if the current age specific mortality rate persists • It is highly influenced by IMR (Infant Mortality Rate). A high life expectancy at birth shows an overall improvement in the health status of a community
IMR • Number of children dying before completing their first year of life per 1000 live births. • It is a sensitive indicator of availability utilization and effectiveness of health care, particularly perinatal care IMR=Deaths of under 1 year children * 1000 Total live births in a given year in same population
Maternal Mortality Rate • It is the number of deaths of women due to child bearing problems expressed per 100,000 live births. In Pakistan the figure is 348 per 100,000 live births
Disease Specific Mortality Rates • Number of people dying due to a particular disease or problem as compared to total number of deaths in a given time in a given community • Reflects Burden of disease in a community
Case Fatality Rate • It is number of people dying due to a disease as compared to total number of people suffering from that disease in a given period of time Reflect the seriousness of danger posed by a given disease Helps in prioritizing a health problem
MORBIDITY INDICATORS • There are diseases with low mortality but high disability rates • Affecting quality and output of a given community
SULLIVAN INDEX • S.I.= Total life expectancy – duration of disability • Sensitive Indicator • Pakistan = 55 years
UTILIZATION RATES • Proportion of people in need of a service who actually receive it in a given period. • Proportion of infants who are immunized against the 7 EPI diseases. • Proportion of pregnant women who receive ante-natal care. • %age of population using family planning • Generally reflects the AVAILABILITY and ACCESSABILITY of health services and attitudes of an individual towards his health and health care system.
Health Policy Indicators • Allocation of adequate resources • Proportion of GNP spent on health services, proportion of total health resources devoted to PHC
EXAMPLE In District Buner (2005)a total of 33500 births took place out of which the hospital records show that 2840 children died under the age of 1 year. Hospital records show that there were 1000 cases o sepsis out of these 870 di4ed due to neonatal sepsis, 800 cases of pneumonia out of which 534 died, 400 out of 515 due to congenital abnormalities, 350 out 900 due to diarrheal diseases, and 316 out of 1000 die because of unknown reasons
Calculate the IMR for district Buner? • Calculate Disease specific mortality rates for sepsis, Pneumonia, and Diarrhea? • Calculate Case Fatality Rates for Sepsis, Sever birth asphyxia, and pneumonia?
STUDY DESIGNS • INCIDENCE Number of new cases of a disease or health related event in a given population in a given time ___________________________________*1000Total population at risk in the given time It shows the Rate at which new diseases or health problems occur in a population
Prevalence Number of new as well as old cases of a disease in a given population in a given time ________________________________*1000Total population at risk in given time • Signifies the burden of disease
Case 1 case 2 case 3 case 4 case 5 case 6 case 7 Case 8 Case 9 Case 10 January 2004 December 2004
Questions • What is the prevalence of Hepatitis B on 1st January 2004? • What is the prevalence of Hepatitis B during the year 2004?
Relation between Incidence and Prevalence • Prevalence = Incidence * Duration of the disease Disease incidence Prevalence Recovery Death
Variation in Incidence and Prevalence • As incidence is “occurrence of new cases”, thus DECREASE in incidence may be due to: • Increased Resistance to the disease • A change in disease Etiology • Reduced exposure to a risk factor by an effective preventive program
DECREASE in prevalence may be due to: • Decrease in incidence • A shorter duration of illness (Rapid recovery or Rapid death)
Case-Control Studies Not Exposed Exposed Exposed Not Exposed Not Diseased Diseased Controls Cases
Hypothetical example of a Case-Control study of CHD and Cigarette smoking
SELECTION OF CASES AND CONTROLS • SELECTION OF CASES • SOURCES • Hospital patients • Physician practice patients • Registered patients of societies Explicitly explained
SELECTION OF CASES AND CONTROLS • SELECTION OF CONTROLS • Non- Hospitalized patients as controls • Neighborehood controls (door to door) • Telephone dialing • Best friend controls • Spouse or sibling control • Hospitalized patients as controls It is captive population so easy to investigate but different from general population • PROBLEM OF RECALL BIAS
CROSS SECTIONAL STUDY Begin with DEFINED POPULATION Then gather data on exposure and disease Not exposed and have no disease Exposed have disease Exposed do not have disease Not exposed having disease
COHORT STUDY • Causal Relationship? ENVIRONMENTAL EXPOSURE ASSOCIATION???? ????? DISEASE OR OTHER OUTCOMES
Case-control Study group is persons with disease (Cases) Comparable group is persons without disease (controls) Outcome is proportion of cases exposed and proportion of controls exposed Cohort studies Study group is persons with exposure Comparable group is persons without exposure Outcome is incidence in exposed and incidence in non-exposed Comparison of
Case-control Measurement of Risk is by Odds Ratio Temporal Relation-ship is hard to establish between exposure and disease Easy to study association of disease with several exposures Cohort Studies Measurement of Risk is by Odds Ratio and Relative Risk Temporal Relation-ship is easy to establish between exposure and disease Easy to study association of exposure with several diseases Comparison of
Case-control Require short time to complete study Relatively inexpensive Requires small population to study Cohort Studies Require long time to complete study because of follow-up Expensive Needs large population to study Comparison of