Download
1 / 9
90 likes | 224 Vues
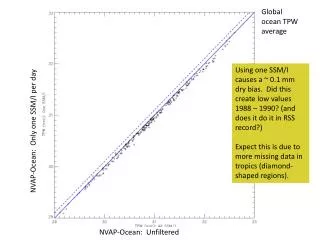
Global ocean TPW average. Using one SSM/I causes a ~ 0.1 mm dry bias. Did this c reate low values 1988 – 1990? (and does it do it in RSS record?) Expect this is due to more missing data in tropics (diamond-shaped regions). NVAP-Ocean: Only one SSM/I per day. NVAP-Ocean: Unfiltered.

E N D
Global ocean TPW average Using one SSM/I causes a ~ 0.1 mm dry bias. Did this create low values 1988 – 1990? (and does it do it in RSS record?) Expect this is due to more missing data in tropics (diamond-shaped regions). NVAP-Ocean: Only one SSM/I per day NVAP-Ocean: Unfiltered
NVAP-O: Blue: Filtered Red: Unfiltered NVAP-O
1988 – 2008 NVAP-Ocean Only where One SSM/I No Filter GA Trend: + 0.508 mm / decade GA Trend: 0.535 mm / decade Reprocessed with one SSM/I per day: +0.530 mm / decade
Global TPW average Start of NOAA-14 NVAP-C: Blue: 2 HIRS, 1 SSM/I Red: Unfiltered NVAP-C
1988 – 2009 NVAP-Climate Only where one SSM/I; two HIRS Unfiltered Global mean trend +0.516 mm / decade Global mean trend: +0.168 mm / decade Insufficient data +3.5 -3.5 (mm / decade) Reprocessed 2-IR; 1-SSM/I +0.454 mm/decade
1988 – 2009 Trends with Data Witholding Unfiltered NVAP-M + 0.51 mm / decade NVAP-Ocean Unfiltered +0.53 mm / decade Two infrared, one SSM/I per day, no sondes + 0.45 mm / decade NVAP-Ocean: One SSM/I per day +0.51 mm / decade Two infrared, one SSM/I per day, No AIRS + 0.48 mm / decade Insufficient data +3.5 -3.5 (mm / decade) HIRS-only: +0.39 mm / decade