Download
1 / 1
10 likes | 144 Vues
hot pixel. off dome. hot pixel. off dome. hot pixel. off dome. hot pixel. off dome. N. off dome. hot pixel. Nov. 1 st , 2000. Dec. 28 th , 2000. Jan. 13 th , 2001. Apr. 13 th , 2002. Aug. 3 rd , 2002. Oct. 29 th , 2002. hot pixel. off dome. T cold. T hot.

E N D
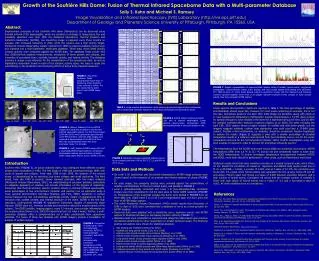
hot pixel off dome hot pixel off dome hot pixel off dome hot pixel off dome N off dome hot pixel Nov. 1st, 2000 Dec. 28th, 2000 Jan. 13th, 2001 Apr. 13th, 2002 Aug. 3rd, 2002 Oct. 29th, 2002 hot pixel off dome Tcold Thot Apr. 14th , 2002 Sally S. Kuhn and Michael S. Ramsey Image Visualization and Infrared Spectroscopy (IVIS) Laboratory (http://ivis.eps.pitt.edu) Department of Geology and Planetary Science University of Pittsburgh, Pittsburgh, PA 15260, USA Abstract Emplacement processes of the Soufriére Hills dome (Montserrat) can be discerned using thermal infrared (TIR) wavelengths, which are sensitive to changes in temperature flux and emissivity variations over time. With the Advanced Spaceborne Thermal Emission and Reflection Radiometer (ASTER), one cloud-free image is captured every three months on average, with increased frequency in 2002, when the volcano was a high priority target. Montserrat Volcano Observatory weekly reports from 1999 to present (available online) were also ingested into a multi-parameter, searchable database. These data, which detail specific volcanic activity, were compared against the ASTER data. The database fields include SO2 flux, GOES-derived radiance measurements, description of dome growth and collapse, and intensities of pyroclastic flows, rockfalls, fumarolic activity, and seismic activity. This database provides a unique cross-reference for the interpretation of the spaceborne data, as well as highlighting observable trends in each of the volcanic activity types. We hope to apply this methodology in the prediction and monitoring efforts of active dome hazards elsewhere. Growth of the Soufriére Hills Dome: Fusion of Thermal Infrared Spaceborne Data with a Multi-parameter Database FIGURE 1. Map of the Caribbean. Detail: topographical hazard map of Montserrat shows English’s Crater outlined in yellow. The box represents the same area of each ASTER image below. FIGURE 7. Graphic representation of numerical data. Weekly totals of rockfall, hybrid events, long-period earthquakes, volcano-tectonic events, sulfur dioxide, and long rockfall signals were plotted from December 31st, 1999 to April 11th, 2003. Sulfur dioxide output is reported in ranges, with the maximum and minimum numbers reported together. Green lines on all graphs represent explosive events (orange on sulfur dioxide graph), blue lines represent ASTER capture. Results and Conclusions TABLE 1. Linear spectral deconvolution results showing aerial percentage of each endmember and corresponding emissivity spectra for the hottest and background temperature pixels. Linear spectral deconvolution results are reported in Table 1.The total percentage of obsidian and blackbody should equal 100, however, for most pixels containing an anomaly, this is not the case. Anomalous pixels for the April 13th, 2002 image are favorable, along with pixels at or near background temperature. Petrographic analysis demonstrates a 5-15% glass content for samples thought to have resided in the dome for a significant amount of time, and 25-30% for samples collected after explosive eruptions [Sparks et al, 2000].The week including the April 13th, 2002 capture shows a higher number of rockfalls and mild dome growth, but the imagery suggests relatively uniform heat distribution over each pixel and a 27-64% glass content. Possibly a third endmember, i.e. andesite, should be considered. Another hypothesis to explain the results (Figure 5) suggests a pixel with a smaller percentage of elevated temperature results in a radiance curve derived from two blackbody curves, one for the cooler temperature and one for the hot temperature [Dozier, 1981]. Further investigation using sub-pixel analysis is required in order to account for anomalous emissivity spectra. The temperatures from the ASTER instrument versus GOES are somewhat inconclusive. ASTER temperatures differ from 1.6 ºC to 13.7 ºC and do not plot consistently higher or lower than the GOES temperatures. To further investigate temperature inconsistencies between ASTER and GOES, more work should be performed in other areas, such as Bezymianny and Unzen. Statistical results show that some variables correlate on a weekly temporal scale, while others do not. Results for correlation #1 based on regression and ANOVA tests reveal a best line of fit as y=353.986 + 0.164x, a p-value of 0.002, and an f-value of 10.375. No correlation was found with #4, except when hybrid activity was separated into two groups, below 25 and 26 and above. Fisher’s exact test shows a p-value of 0.008 between explosive behavior and a high number of hybrid events. Correlation #6 shows that the average number of rockfalls is fewer with high values of hybrid events with a t-value of -3.2 and a two-tailed p-value of 0.002. All other variables show no correlations. FIGURE 4. ASTER system response functions (far left) in thermal wavelengths. Linear spectral deconvolution endmembers (left), showing blackbody in blue and obsidian in red. FIGURE 2. (Above) Subsets of the six ASTER images showing dome anomalies in the thermal infrared wavelength regions. The first three images (2000 and 2001) were captured at approximately 10:40 PM local time, while the 2002 images were captured at approximately 10:40 AM local time. Note the saturated pixels within the dome anomalies. Scale: 5.4 km wide. FIGURE 3. (Left) Subset of GOES image (left) and a resampled ASTER image (right) for comparison. Red brackets indicate top and bottom of island. GOES image spans 296 km across. ASTER is 60 km. FIGURE 5. Illustration showing separated radiance curves for an example pixel with 10% at 300° C (Thot) and 90% at 25° C (Tcold). Introduction Soufriére Hills(FIGURE 1), an active andesitic dome, has undergone three different eruptive phases since reactivation in 1992. The first began in 1995 and continued through 1998, with cycles of growth and collapse. From early 1998 to late 1999, the duration of the second phase, is characterized by no extrusion, but dome collapse and small explosions. The third phase, from late 1999 to present, shows renewed extrusion, with two major collapses [Montserrat Volcano Observatory, 2002]. An understanding of extrusion behavior, particularly an adequate degassing of volatiles, can provide information on the triggers of explosivity. Presuming that thermal emission spectra combine linearly in thermal infrared wavelengths, aerial percentages of two end-members (obsidian and vesicles) can be estimated using a linear spectral deconvolution technique [Ramsey and Fink, 1999]. Variations in surface texture between the two end-members specifically provide insight of emplacement time or extrusion rate, volatile content, and internal structure of the dome. ASTER is the first high resolution, multi-spectral (FIGURE 4) spaceborne instrument capable of discerning these features. ASTER does not, however, provide any information about the eruptive phase of the volcano. The GOES satellite, imaging approx. every 15 minutes, does provide information on the eruptive phase [Harris et al, 2001] if tracked long term (at least a week). Further, a multi-parameter database offers a complementary set of data unobtainable from spaceborne satellites. The fusion of these two datasets with ASTER imagery provide a foundation for analysis of surface texture. Data Sets and Methods • Six Level 2 05 (emissivity) and 06 (kinetic temperature) ASTER image products were chosen based on the presence of an anomaly and relative absence of clouds (FIGURE 2) • For each image, the emissivity spectra were unmixed against the endmembers of obsidian and blackbody for the four hottest pixels, and plotted in FIGURE 4. • Level 2 (atmospherically corrected) and Level 1 B (non-atmospherically corrected) images were then resampled to 4x4 km pixel sizes to mimic GOES resolution (FIGURE 3). Temperatures of the pixel that includes the dome were plotted in FIGURE 6 for all three data sets. GOES band 5 (11.5-12.5 μm) temperatures span one hour prior and hour of ASTER image capture. • The online Montserrat Volcano Observatory (MVO) weekly reports from December of 1999 to April of 2002 were converted into a database to serve as a look-up table for ASTER imagery. • Numerical data were graphed with a smoothing curve, explosive events, and ASTER capture to illustrate increasing or decreasing trends in activity (FIGURE 7). • Statistical tests were conducted on numerical and categorical data based upon previous correlations determined by other researchers on smaller temporal scales. The following positive correlations were chosen for statistical analyses: • 1. Gas venting and rockfall [Luckett et al, 2002] • 2. Rockfall and long-period events [Cole et al, 1998] • 3. Hybrid events should precede dome collapse [Neuberg et al, 1998] • 4. Hybrid events should precede major explosions [Neuberg et al, 1998] • 5. Long-period events should precede major explosions [Miller et al, 1998] • 6. Hybrid events should precede rockfall [White et al, 1998] • 7. Hybrid events linked to violent degassing [White et al, 1998] • 8. Long-period events should precede and follow large hybrid events [White et al, 1998] • 9. Collapses preceded by long-period and hybrid events [Neuberg et al, 2000] • 10. Volcano-tectonic events should be low during dome growth [Miller et al, 1998] References Cole et al., Pyroclastic flows generated by gravitational instability of the 1996-97 lava dome of Soufriére Hills Volcano, Montserrat. Geophys. Res. Lett., 25, pp. 3425-3428, 1998 Dozier, J., A method for satellite identification of surface temperature fields of sub-pixel resolution. Remote Sens Environ, 11, pp. 221-229, 1981 Druitt, T. H., and Kokelaar, B. P. (eds). The Eruption of Soufriére Hills Volcano, from 1995 to 1999. Geological Society, London, Memoirs, 21, 595-602, 2002 Harris, A.J.L., Pilger, E., Flynn, L.P., Web-Based Hot Spot Monitoring using GOES: What it is and How it Works. Advances in Environmental Monitoring and Modeling, 1, pp. 3-31, 2001 Miller et al., Seismicity associated with dome growth and collapse at the Soufriére Hills Volcano, Montserrat. Geophys. Res. Lett., 25, pp. 3401-3404, 1998 Montserrat Volcano Observatory, http://www.mvo.ms/ Neuberg et al., Results from the broadband seismic network on Montserrat. Geophys. Res. Lett., 25, pp. 3661-3664, 1998 Neuberg et al., Models of Tremor and low-frequency earthquake swarms on Montserrat. J. Volcanol. Geotherm. Res., 101, pp. 83-104, 2000 Ramsey, MS and Fink, JH. Estimating silicic lava vesicularity with thermal remote sensing: a new technique for volcanic mapping and monitoring. Bull Volcanol., 61:32-39, 1999 Sparks et al., Control on the emplacement of the andesite lava dome of the Soufriére Hills volcano, Montserrat by degassing-induced crystallization. Terra Nova, 12, p. 14, 2000 White et al., Observations of hybrid seismic events at Soufriére Hills Volcano, Montserrat: July 1995 to September 1996. Geophys. Res. Lett., 25, pp. 3657-3660, 1998 FIGURE 6. Comparison of GOES band 5 (non-atmospherically corrected), ASTER L2 (atmospherically corrected), and ASTER L1B (non-atmospherically corrected) temperatures of the pixel that includes the dome. GOES data was not available for December 28th, 2000.