Download
1 / 57
570 likes | 793 Vues
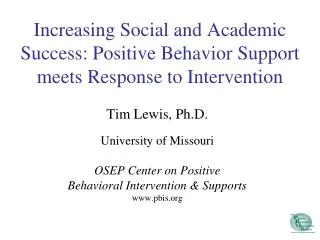
Integrating Behavior and Academics: SWPBS & Response to Intervention. Tim Lewis, Ph.D. & Erica Lembke, Ph.D. University of Missouri Carol Garman, Ed.D. Columbia, MO School District. The Challenge. Appropriate social behavior is expected across all school settings

E N D
Integrating Behavior and Academics: SWPBS & Response to Intervention Tim Lewis, Ph.D. & Erica Lembke, Ph.D. University of Missouri Carol Garman, Ed.D. Columbia, MO School District
The Challenge • Appropriate social behavior is expected across all school settings • Unlike academic behavior, measures/curriculum do not “occasion” behavior • Limited direct measures of social behavior to allow placement in appropriate level of support
Academic Systems Behavioral Systems • Intensive, Individual Interventions • Individual Students • Assessment-based • High Intensity • Intensive, Individual Interventions • Individual Students • Assessment-based • Intense, durable procedures • Targeted Group Interventions • Some students (at-risk) • High efficiency • Rapid response • Targeted Group Interventions • Some students (at-risk) • High efficiency • Rapid response • Universal Interventions • All students • Preventive, proactive • Universal Interventions • All settings, all students • Preventive, proactive Designing School-Wide Systems for Student Success 1-5% 1-5% 5-10% 5-10% 80-90% 80-90%
What is Response to Intervention? • A model or structure that districts can adopt to enhance instructional effectiveness through the use of evidence-based practice and systematic data collection • Under federal and state guidelines, districts can adopt an RtI model to aid in enhancing instruction and identifying students with learning disabilities
How is RtI being conceptualized in the schools? • Tiered model of instruction and intervention • Research-based core programs and interventions • School-wide screening data to identify students at-risk • Frequent progress monitoring to examine the on-going performance of students at-risk
Basics of RTI—Primary Prevention (Tier 1) • All students screened to determine which students are suspected to be at risk. • Students suspected to be at risk remain in primary prevention, with progress monitoring. • Progress monitoring • Disconfirms risk. These responsive students remain in primary prevention OR • Confirms risk. These unresponsive students move to secondary prevention.
Basics of RTI—Secondary Prevention (Tier 2) • Research-based tutoring • Provided in small groups either by the general education teacher or specialists • With monthly or weekly progress monitoring • At end of tutoring trial, progress monitoring indicates students were • Responsive to Tier 2 tutoring. These responsive students return to primary prevention, but progress monitoring continues OR • Unresponsive to Tier 2 tutoring. These unresponsive students move to tertiary prevention (could be special education).
Basics of RTI—Tertiary Prevention (Tier 3) • More intensive intervention OR Special education services • With weekly progress monitoring • Progress monitoring is used to • Design Individualized instructional programs OR • Set Individualized education program (IEP) goals • Monitor student response • When progress monitoring indicates the student achieves benchmark performance, in some districts, the student exits special education or Tier 3 (i.e., returns to primary or secondary prevention), with ongoing progress monitoring.
Critical elements that districts need in place to effectively implement RtI • Well-functioning, school-based problem-solving teams • School wide screening and progress monitoring system • Needs to be technically adequate (Curriculum-Based Measurement (CBM) is one example) • Systematic analysis of school-wide data • Utilize decision-making rules • Examine current core academic programs • Are these programs meeting the needs of the majority of the students?
Critical elements that districts need in place to effectively implement RtI, cont. • Identify evidence-based interventions for Tiers 2 and 3 and a schedule for implementation of the tiered interventions • Determine how fidelity of treatment for Tiers 1-3 will be assessed • Monitor the progress of students in Tiers 2 and 3 on a frequent basis • Setting goals • Collecting data • Implementing data decision rules • Making changes in instruction
What system can be used to monitor the effectiveness of RTI? • Curriculum-Based Measurement (CBM)—use for screening and progress monitoring • CBM provides an easy and quick method for gathering student progress • Teachers can analyze student scores and adjust student goals and instructional programs • Student data can be compared to teacher’s classroom or school district data
Research support • Over 30 years of research support the use of CBM to… • Increase student achievement (Fuchs, Deno, & Mirkin, 1984) • Make predictions about who will succeed on high-stakes assessments (Good, Simmons, & Kameenui, 2001) • Help teachers identify when instructional changes are needed (Fuchs, Fuchs, & Hamlett, 1993) • Develop classroom, school, or district norms (Shinn, 2002) • Increase ease of communication with parents, teachers, students, and others (Shinn, Habedank, & Good, 1993)
Tier IUse CBM within a school-wide screening system, monitoring all students’ performance 3-4 times per year Tier II Use CBM to monitor the performance of the students that need strategic intervention on a monthly basis Using CBM within a RTI framework Tier III Use CBM to monitor the performance of the students that need the most intensive intervention on a weekly basis
Curriculum-Based Measurement • As an example, in reading • Not interested in making kids read faster • Interested in kids becoming better readers • The CBM score is an OVERALL INDICATOR of reading competence • Students who score high on CBMs are better: • Decoders • At sight vocabulary • Comprehenders • Correlates highly with high-stakes tests
Overall Indicator • Data from CBM measures serve as indicators of academic proficiency in subject areas such as math and reading, just like… • Temperature in degrees serves as an indicator of overall wellness • Weight in pounds serves as an indicator of overall health • A litmus test serves as an indicator of a solution’s acidity
How do temperature and weight and a litmus test relate to monitoring academic skills? • We want a graph of “educational health” or “educational strength.” • What do we measure?
Measuring Educational Health • We want to measure “educational health or strength” using something that is: • Inexpensive • Easy • Time efficient • Sensitive to change • Easy to understand • An INDICATOR of educational health • The measures do tell us if our teaching is effective. The measures do not tell us what to teach.
Measures Used For Monitoring • Pre-Reading/Reading • Early Literacy measures (letter sounds, onset, phoneme segmentation) • Correct words (reading aloud) • Correct choices (maze) • Content-area Learning • Correct matches (vocabulary) • Spelling • Words correct • Correct letter sequences • Math • Algebra • Estimation • Computation • Concepts and Applications • Early Numeracy Measures • Problems correct • Digits correct • Written Expression • Words spelled correctly • Correct word sequences • Correct minus incorrect word sequences
Administration • These measures are standardized and we can use nationwide norms because… • We are consistent in how we administer the probes • We are consistent in how we score the probes • The probes that we use have documented reliability and validity
MOST IMPORTANTImplement instructional changes based on decision-making rules • Monitor adequacy of student progress and design effective, individualized instructional programs • Decision rules for graphs: • Trend line rule-- If 4 weeks of instruction have occurred AND at least 8 data points have been collected, figure trend of current performance and compare to goal line • 4-point rule—If 3 weeks of instruction have occurred AND at least 6 points have been collected, examine the 4 most recent data points
Based on Trend trend-line X X X goal-line
Four-Point Method X goal-line most recent 4 points
Member involvement • Involve all relevant stakeholders • Determine role for each team member—just like in cooperative learning! • Note taker • Timer • Social chair—make sure each person contributes or is given the opportunity to contribute • Data guru—this might be you! • Evidence-base questioner—intervention specialist • Other?
Decision-making Rubric • To be implemented at least every 6 to 8 weeks • Three questions to guide discussion on data at problem solving team meetings: • What is the student’s goal? Current level? • What decision-making rule are we using (i.e., trend line)? Can we apply that now? • If a change needs to be made, what do we do?
FIRST, to make a decision on movement/non-movement within tier 3, the rubric should be applied. • SECOND, if a change needs to be made, the team questions: • Intensity • Fidelity • Evidence-based of intervention • Duration
Using research-validated instructional procedures: Is there evidence for their effectiveness? How do we determine this?
Evidence-based practices • Replicated in a variety of settings • Sample reflects the population for which we’re seeking answers • Utilize a control group—Implemented with one group while being compared to a control that is not getting the intervention • Procedures are clearly described (so that the study could be replicated) • Published in peer-reviewed journals
Treatment fidelity • One of the key components of RtI is lack of response to validated instruction, implemented with integrity • Need to check on fidelity of implementation. How can this be done? • Checklists, observation, discussion, video • The purpose of fidelity checks is to create open dialogue regarding what is effective and what needs to be altered • Should be an OPEN process—no surprises here!
Research-validated practices • ‘Quick’ places to check • Google Scholar--http://scholar.google.com/ • Find relevant, research-based references for interventions you’re considering • John Hopkins Evidence Encyclopedia • Bestevidence.org • Doing what works (dww.ed.gov) • New website sponsored by the U.S. Department of Education. DWW is dedicated to helping educators identify and make use of effective teaching practices. • What works clearinghouse (http://ies.ed.gov/ncee/wwc/) • Florida Center for Reading Research website of programs • Fcrr.org
Eugene Field Elementary School“Inspiring and empowering each other to positively impact our community and our world.” Our Journey to Responsive Intervention
Who are we? Our students: • 290 students Preschool-5th grade • 3 classes per grade level K-1 • 2 classes per grade level with 18-25 students per class • 86% F/R lunch • 50% African American • 20% Hispanic • 13% special ed • 58% mobility
Who are we? Our staff: 2 Administrators 14 General Educators 3 Special Educators 3 Specialists 3 Interventionists 1 Literacy Coach 1School Psychologist (part-time)
RtI Concept to Practice • Research-based core programs • School-wide screening • Tiered model of instruction and intervention
Beginning with PBS in 2003-2004 • Commitment • Team Process • Communication • Defining Expectations • Directly Teaching Expectations • Frequent, Positive Performance Feedback • Corrective Response • Data-based Decision Making
Field Elementary Discipline Data 04-05 6.4% 16.8% 76.8%
Evolution of PBS • Administrative Support + Teacher Leadership • All Grades and Groups Represented on PBS Team • Morning Announcements & Signage • Matrix Developed, Reviewed, & Publicized, Classroom Matrices Developed, Reviewed, & Posted • Tiger Tool Lessons written by Team, Administrative Observations & Teacher Feedback • Formalizing Safe Seat & Buddy Room Guidelines • Mannerly Moment Loops & Schoolwide Celebrations Every 6 Weeks • Consistency of Data Reporting & Response to Intervention Log Used • Data Reports Shared Monthly Focusing on “Time Out of Instruction”
We Learned That Our Students : • Responded to a Structured Environment • Responded to Explicit Instruction • Could learn… • We Focused on What We Could Change at School to Better Support All Students Behaviorally and Academically
Literacy Component Added in 2005-2006 • Collaboration between building, district and community members • Shifting Targeted Title 1 to School-wide Title 1 • “Essential Features” Included • prioritized time for literacy • a structured, research-based core literacy curriculum • a three-tiered approach to intervention • consistent and monitored implementation • support for effective implementation • support for strategic and intensive interventions as needed • progress monitoring to insure effectiveness of system • collaboration time
Core K 9:00-10:30 1st 9:00-10:30 2 10:00-11:30 3 11:00-12:30 4 1:45-3:15 5 1:00-2:30 Intervention 12:25-12:55 11:30-12:15 9:15-10:00 10:15-11:00 1:00-1:45 2:15-3:00 Core Reading and Intervention Schedule
Also utilize as needed: • Developmental Reading Assessment (DRA & DRA-2) • Scholastic Reading Inventory (SRI) • District Writing Assessments
Formalizing Problem Solving Team in 2007-2008 • Designed procedures, processes and forms for 2 PSTs (Academic and Behavioral) • Strategically chose members and leaders for each team • Trained team members on RtI Framework • PST Case-managers meet 1-1 with teachers to narrow focus of concerns and develop measurable problem statement(s) and assist in collecting baseline data
Where Have We Been &Where Are We Now? • 2003-2004 We began a building-wide process to implement Positive Behavior Support. • 2004-2005 We began the formal process for becoming a professional learning community by developing a common vision,mission, and purpose. Planning for School-wide Title I. Looked at all data and discussed plans for school improvement. • 2005-2007 We focused on building a collaborative culture and student learning. We began implementation of a Strategiec Three Tier Model for Literacy Instruction. • 2007-2008 We have the structure in place and now we are looking at the most effective instructional practices known to increase student achievement: PBS, Three Tier Literacy Support and PST • The conversations are rich with data and ideas for improving student academic and social skill learning. • The PBS Team meets twice per month to continually monitor the implementation with fidelity of the Action Plan • All interventionists meet twice monthly with the grade level teachers to discuss best practice, observations and student progress.