Download
1 / 10
100 likes | 172 Vues
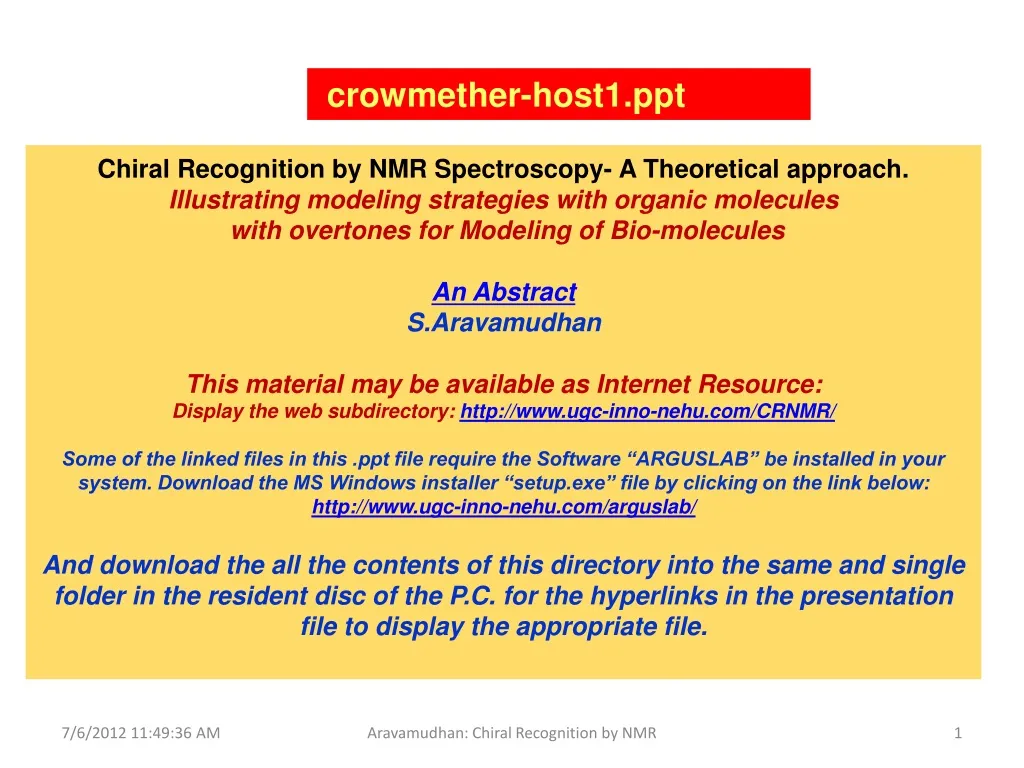
crowmether-host1.ppt. Chiral Recognition by NMR Spectroscopy- A Theoretical approach. Illustrating modeling strategies with organic molecules with overtones for Modeling of Bio-molecules An Abstract S.Aravamudhan This material may be available as Internet Resource:

E N D
crowmether-host1.ppt Chiral Recognition by NMR Spectroscopy- A Theoretical approach. Illustrating modeling strategies with organic molecules with overtones for Modeling of Bio-molecules An Abstract S.Aravamudhan This material may be available as Internet Resource: Display the web subdirectory: http://www.ugc-inno-nehu.com/CRNMR/ Some of the linked files in this .ppt file require the Software “ARGUSLAB” be installed in your system. Download the MS Windows installer “setup.exe” file by clicking on the link below: http://www.ugc-inno-nehu.com/arguslab/ And download the all the contents of this directory into the same and single folder in the resident disc of the P.C. for the hyperlinks in the presentation file to display the appropriate file. Aravamudhan: Chiral Recognition by NMR
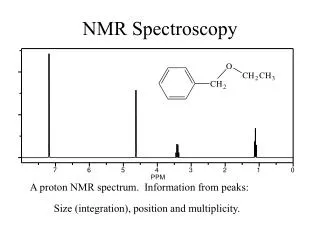
The Chiral recognition by NMR require: • NMR spectrum of the Host molecule • NMR spectrum of the Guest (Chiral) molecule • NMR spectrum of the Host-guest complex. Slide#3 • Identifying the spectral lines/region which indicates the dependence on the complexing by the guest. (typically from Slide # 6) • And, monitoring the indicator peaks with the concentration of the Guest molecule (illustrated in Slide# 10). This means a theoretical calculation would require calculation of the NMR of the complex molecule for various Stoichio metric proportions and hence Host to Guest molar ratios - 1:2, -1:1, - 2:1, -etc ., to be specifying a few typical ratios. To cover non-integral ratio values, the required integral number of cluster molecules would demand handling large sized molecular cluster than for the above simple integral ratios. For such clusters Host-host, guest-guest interactions and changes in structures of host and guest molecule structures would be factors to reckon with. • This would mean the super molecular system to handle would increase in size depending on the complex as compared to the size of the guest molecule alone or the host molecule alone. The increase in computation time, and while trying to optimize the time factor, what options could be exercised on the theoretical method and basis sets, must be spelt out with the corresponding advantages/disadvantages. S.Aravamudhan CRNMR
In the optimized structures on the right hand side, the guest and host are placed at shorter inter molecular distances. Note the crowding of lines between 4 & 5ppm. On the left hand side the spectral lines are more spread out in the region 2.5-6 ppm As also seen in SLIDE # 6 Host-guest complex STRUCTURE and NMR To Slide#2 Only chemical shifts calculated : No spin-spin coupling included S.Aravamudhan CRNMR
Alanine- an amino acid: Small molecule unit of biological macromolecules S.Aravamudhan CRNMR
S R An expanded view of this region is in Slide #7 To Slide#2 S.Aravamudhan CRNMR
Slide #3 The third spectrum (lower) seems an addition of the features of the first two spectrum (above) as much as the third structure consists of both the individual molecules of the above two molecules. Hence a guest-host distance dependence is in sequence for the trends determining differentiating features in PMR Dr S Aravamudhan CRNMR
These expanded regions are part of the full spectrum obtained using the calculated chemical shifts. Next slide depicts a simulated spectrum obtained using an “FID Simulator” with the same set of chemical shifts. SLIDE # 6 S.Aravamudhan CRNMR
With this illustration of a simulation, for the complexation of two chiral forms of the ligand ( above and below in the respective columns), the next stage is set for looking for the trends of variations in Chemical shifts for different stoichiometric composition, and the calculable chemical variations. To Slide#2 S.Aravamudhan CRNMR