Download
1 / 28
400 likes | 2.07k Vues
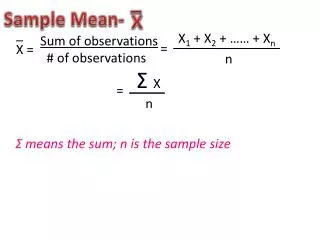
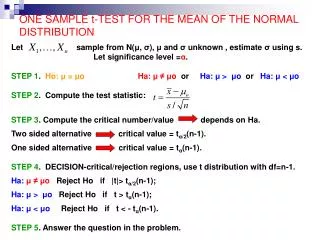
Formula for the sample mean . The sample mean is calculated using a formula: x bar is the symbol for the mean “sum all the observations of x, and divide by n”. Formula for the population mean. The population mean is calculated using a formula: (mu) is the symbol for the population mean

E N D
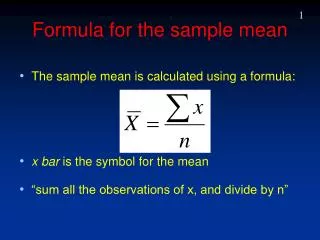
Formula for the sample mean • The sample mean is calculated using a formula: • x bar is the symbol for the mean • “sum all the observations of x, and divide by n”
Formula for the population mean • The population mean is calculated using a formula: • (mu) is the symbol for the population mean • “sum all the observations of x, and divide by n”
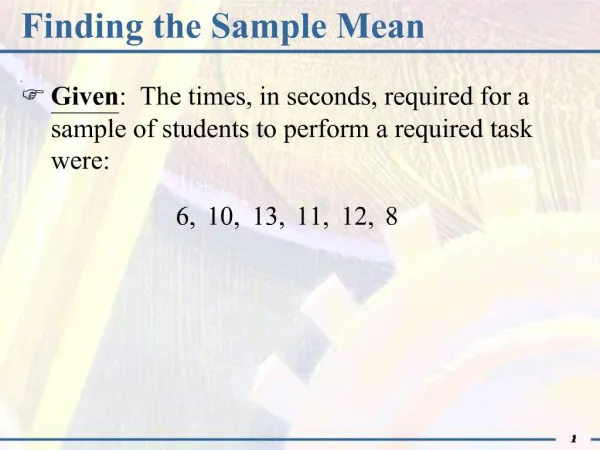
Example: calculating the mean • Consider x, with a sample of observations: • 12 15 22 37 11 40 32 14 • Step 1: Sum all the x values • 12+15+22+37+11+40+32+14 = 183 • Step 2: Divide the sum by n • n = 8 • 183/8 = 22.875 • The mean is 22.875 (or, if rounded, 22.88)
Using each of them • They each say something different • mode: which value is most frequent? • median: which value represents the position halfway through the data? • Mean: what is the average value of observations?
Measures of Variability • People are all slightly different (that’s what makes it fun) • Not everyone scores the same on the same scale • This is interesting for us - must take it into account • The variation tells us about the differences between people we studied Tutorial 5 in Numbers
Example of variability • Imagine this variable • 5 7 3 8 2 2 9 1 9 3 • The mean is 4.9 • We sort of expect 4.9 to be representative of the scores, but: The data is at the edges - not at all close to 4.9!
A second sample: • Look at this one: • 4 4 4 5 5 5 5 6 6 • The mean is also 4.9 • But the distribution: Same mean as before, but the numbers are very clustered close to the mean!
How do we explain this difference? • Both have the same mean • the mean obviously doesn’t tell the whole story! • What is the actual difference between those data sets? • The left one is more “spread out” than the one on the right
Variability • Measures of variability capture this “spreadness” of the data • not applicable to nominal or ordinal variables • Various ways to measure it • How far does the data stretch? • How far, on average, is it spread from the mean?
Extent of the data - the range • The range is the total ‘width’ of the data set • Consider x : • 7 4 3 4 5 6 3 • These values range all the way from 3 (the smallest value) to 7 (the biggest value) - its range is 4 • Easy to calculate: • rangex = max(x) - min(x) • (the largest value of x minus the smallest value of x) • A high range value means the data is very widely spread
Example: calculating the range • Calculate the range for x, from the sample: • 26 28 32 15 25 12 • Step 1 - find the largest value of x • in this sample, it is 32 • Step 2 - find the smallest value of x • in this sample, it is 12 • Step 3 - biggest minus smallest • 32 - 12 = 20 • The range is 20
Why the range is cool, sometimes… • Gives an idea of how far spread the data is • a higher range number means the data is more spread apart • Can compare various sample ranges to see which is spread the most • But: can’t distinguish between these two samples (both have range = 10)
A better idea of variation • The right histogram shows more clustering, but has a few values which “throw off” the range • Range can be fooled by “extreme values” - outliers • There exist better measures which are more “outlier proof”
Outlier proofing - Variance • The variance presents a better measure of data spread • not as easily influenced by outliers • Variance is based on the average distance of the scores from the mean • Still useful - bigger values mean more spread
Calculating variance (brace yourself) • Population variance is calculated using a formula: Variance is the mean of the squared deviations of the observations
Calculating variance (brace yourself) • Sample variance is calculated using a formula: Variance is the mean of the squared deviations of the observations
Calculating variance (in English) • Easy if broken down into 5 small steps! • Step 1: Work out the mean of x, and n • Step 2:For each data point, work out the deviation (x minus the mean of x) • Step 3:For each data point, square the deviations you got above • Step 4: Add all the squared deviations together • Step 5: Divide your sum by n (minus 1)
Example: working out s2 • Work out the variance for x, based on the sample: • 16, 12, 15, 14, 20 • By the numbers! • Step 1: work out the mean and n • n is 5 • 16+12+15+14+20 = 77 • 77 / 5 = 15.4 • The mean is 15.4
Example: working out s2 • For the remaining steps, make yourself a table: • x x-x (x-x)2 Each column is a step - fill in one at a time
Example: working out s2 • Step 2: Work out the deviation (x minus mean of x) x x-x (x-x)2 16 0.6 12 -3.4 15 -0.4 14 -1.4 20 4.6
Example: working the variance • Step 3: Square the deviations (column 2 times column 2) x x-x (x-x)2 16 0.6 0.36 12 -3.4 11.56 15 -0.4 0.16 14 -1.4 1.96 20 4.6 21.16
Example: working the variance • Step 4: sum the squared deviations • 0.36+11.56+0.16+1.96+21.16 = 35.2 • Step 5: divide the sum by (n-1) • n = 5 • n-1 = 4 • 35.2 / 4 = 8.8 • The variance of this data set is 8.8 • Simple, but tedious!
Variance: The bad news • Variance is a good measure of spread, but it is in odd units • A bigger number means more spread, but the number itself means very little • Because we square in the formula, we cause the numbers to lose their scale • The variance of an IQ scale is not in IQ points • Would be nice to have a measure of variation which is in the correct units!
The Standard Deviation • The standard deviation is a measure of variation • Has all the good properties of the variance • PLUS it is in the same scale as the variable • Standard deviation of IQ scores is expressed in IQ points • Gives and intuitive understanding of how far apart the scores truly are spread • “Scores were centered at 100 and spread by 15”
Calculating the standard deviation • Very simple formula • sample • population • To work it out, calculate variance and then take its square root
Example: working out s • Work out the variance for x, based on the sample: • 16, 12, 15, 14, 20 • Step 1: Work out the variance • s2 = 8.8 (from the previous example) • Step 2: find the square root: • 8.8 = 2.966 The standard dev is 2.966
Variance and standard deviation • If you have variance, it is easy to work out standard deviation • Square root the variance • If you have the standard deviation, it is easy to work out the variance • Square it
Using the standard deviation with the mean • By looking at the mean and std deviation at the same time, we can get a good idea of a variable: B Mean: 5.35 Std dev: 2.3 A Mean: 5.35 Std dev: 1.008