Protein Classification
Protein Classification. A comparison of function inference techniques . Why do we need automated classification?. Sequencing a genome is only the first step. Between 35-50% of the proteins in sequenced genomes have no assigned functionality.

Protein Classification
E N D
Presentation Transcript
Protein Classification A comparison of function inference techniques
Why do we need automated classification? • Sequencing a genome is only the first step. • Between 35-50% of the proteins in sequenced genomes have no assigned functionality. • Direct observation of function is costly, time consuming, and difficult.
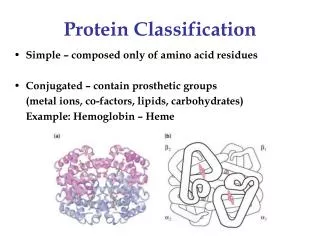
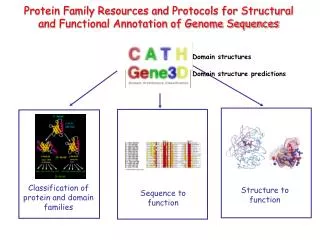
Protein Domains • The tertiary structure of many proteins is built from several domains. • Often each domain has a separate function to perform for the protein, such as: • binding a small ligand (e.g., a peptide in the molecule shown here) • spanning the plasma membrane (transmembrane proteins) • containing the catalytic site (enzymes) • DNA-binding (in transcription factors) • providing a surface to bind specifically to another protein • In some (but not all) cases, each domain in a protein is encoded by a separate exon in the gene encoding that protein.
Inference through sequence similarity ProtoMap: Automatic Classification of Protein Sequences, a Hierarchy of Protein Families, and Local Maps of the Protein Space (1999)
Observations • Sometimes you don’t know where the domains are. • It is generally accepted that two sequences with over 30% identity are likely to have the same fold. • Homologous proteins have similar functions. • Homology is a transitive relationship.
Departures • Authors do not attempt to define protein domains or motifs. • Not dependant on predefined groups or classifications. • Chart the space of all proteins in SWISSPROT, as opposed to individual families • Produce global organization of sequences.
Algorithm Overview • We construct a weighted graph where the nodes are protein sequences and the edges are similarity scores. • Cluster the network considering only those edges above some threshold. • Decrease similarity threshold and repeat.
Measuring Sequence Similarity • Expectation value used. This the normalized probability of the similarity occurring at random. • Lower value implies logarithmically stronger similarity.
Finding Homologies • Very difficult to distinguish a clear threshold between homology and chance similarity. • Authors chose e = .1, .1, and .001 for SW, FASTA, and BLAST, respectively. • Spent a lot of time empirically determining these thresholds.
Clustering Clustering is done iteratively. Start with a threshold of E < 10-100 Cluster and increase threshold by a factor of 105 Sublinear threshold prevents the collapse of sequence space
ProtoMap: Results • Produces well-defined groups which correlate strongly to protein families in PROSITE and Pfam.
ProtoMap: Limitations • Analysis performs poorly by families dominated by short/local domains (PH, EGF, ER_TARGET, C2, SH2, SH3, ect…) • High scoring, low complexity segments can lead to nonhomogeneous clusters. • “Hard” clustering vs. “Soft” clustering • Has difficulty classifying multidomain proteins.
ProtoMap: Future Directions • 3D structure/fold • Biological function • Domain content • Cellular location • Tissue specificity • Source organism • Metabolic pathways
Inference through protein interaction networks Functional Classification of Proteins for the Prediction of Cellular Function from a Protein-Protein Interaction Network (2003)
PRODISTIN • Very similar to ProtoMap, only the data used to produce the graph is a list of binary protein-protein interactions instead of sequence similarity scores • Sequence similarity not a dominating factor in PRODISTIN clusters
Problems with PRODISTIN • Paucity of protein-protein interaction data (average # of connections = 2.6) • Either very robust or very indiscriminant
Problems: Multidomain and Nonlocal Proteins • protein kinases • hydrolases • ubiquitin… PRODISTIN: Present problems in clustering by biochemical function ProtoMap: Can create undesired connection among unrelated groups
Scale-Free Networks • Node connection probability follows a power law distribution • Maximum degree of separation grows as O(lg n) • Highly robust under noise, except at hubs and superhubs. P(linking to node i)
Metabolic Networks • The E. coli metabolic network is scale-free. • Actually, the metabolic networks of all organisms in all three domains of life appear to be scale-free (43 examined) • The network diameter of all 43 metabolic networks is the same, irrespective of the number of proteins involved. • Is this counter-intuitive? Yes. http://biocomplexity.indiana.edu/research/bionet/
Protein Domain Networks • Protein Domains – Nature’s take on writing modular code • Reconciles apparent paradox of a fixed network diameter across species – despite vast differences in complexity (some human proteins have 130 domains) • Occurrence of specific protein domains in multidomain proteins is scale-free. http://mbe.oupjournals.org/cgi/content/full/18/9/1694
Protein Domain Graphs • Prosite domains have a distribution following the power-law function f(x) = a(b + x)-c, with c = .89. There are few highly connected domains and many rarely connected ones. • ProDom and Pfam domains follow the power function y = 2.5 for ProDom y = 1.7 for Pfam
Conclusions • The accuracy of both ProtoMap and PRODISTIN is limited because they make the tacit assumption of a random network topology. • Protein-Protein interaction networks have scale-free topology, foiling PRODISTIN • Protein Domain networks have scale-free topology, foiling ProtoMap • Any protein classification algorithm that performs better than ProtoMap is probably going to have to address this issue.