Download
1 / 19
200 likes | 392 Vues
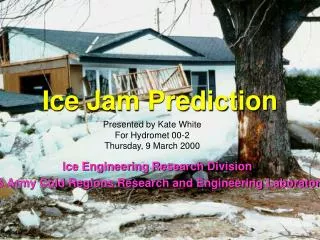
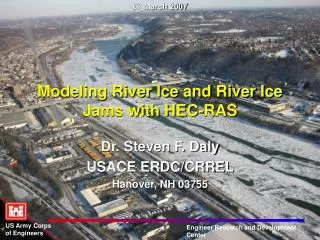
US Army Corps of Engineers ® Engineer Research and Development Center. Development of Empirical Threshold Models for Ice Jam Forecasting and Modifications to FLDWAV to Model River Ice. Dr. Steven F. Daly ERDC/CRREL Hanover , NH 03755. Overview.

E N D
US Army Corps of Engineers ® Engineer Research and Development Center Development of Empirical Threshold Models for Ice Jam Forecasting and Modifications to FLDWAV to Model River Ice Dr. Steven F. Daly ERDC/CRREL Hanover , NH 03755
Overview • Objective: The overall object is to improve the National Weather Service River Forecast Centers ability to forecast wintertime flooding due to river ice. • Development of Empirical Threshold Models for Ice Jam Forecasting • Modifications to FLDWAV to Model River Ice
Empirical Threshold Models for Ice Jam Forecasting • The goal is to develop empirical threshold indicators of river ice formation, ice cover breakup, jam formation, and ice jam flooding. The indicators will be based on information that is readily available to the RFC's or could be easily derived from existing data sources. Proposed indicators include Accumulated Freezing Degree Days (AFDD), rate of change of discharge, maximum discharge, and other factors.
Modifications to FLDWAV to Model River Ice • The effects of an ice cover will be incorporated into the NWS FLDWAV model which is part of the National Weather Service River Forecast System (NWSRFS) to model ice jams under unsteady flow conditions.
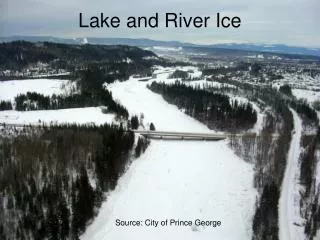
Platte River 243 • Yukon River 211 • Kuskokwim River 194 • Connecticut River 90 • Milk River 60 • Kankakee River 40 • Allegheny River/Oil Creek 33 • Mohawk River 30 • Missouri River at Williston, ND 29 • Salmon River 25 • Weiser River 20 TOTAL 1075
Analysis • Assigned each ice event to the next d/s flow gage & assigned each gage to a met station, average flow over POR, DA, Average maximum AFDD • For each ice event: • Base flow (lowest 40 days discharge in the since the start of the water year) • Q, the flow associated with the event • DelQ, the flow increase • Tp, the time to peak • AFDD, the accumulated Freezing degree days
Analysis • For all the ice events assigned to each gage, we then found the overall average of • Base flow (lowest 40 days discharge in the since the start of the water year) • Q, the flow associated with the event • DelQ, the flow increase • Tp, the time to peak • AFDD, the accumulated Freezing degree days
Summary • Thresholds can be developed for each reach based on %AFDD and DelQ or other • There will be uncertainty because of large variation in data • High, medium, low probability of ice event • Salmon River true freeze up case. • Remains to write up