Download

1 / 21
220 likes | 647 Vues
A Look into America’s Weather. NSF North Mississippi GK-8 Project Created By: Leah Craft Grade Level: 7th. Tornado. Hurricane. Snow. Rain. Ice. Thunder. What is weather?. Where does weather occur?. The Science of Weather.

E N D
A Look into America’s Weather NSF North Mississippi GK-8 Project Created By: Leah Craft Grade Level: 7th
Tornado Hurricane Snow Rain Ice Thunder What is weather?
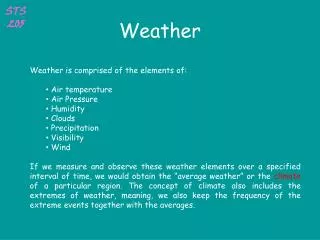
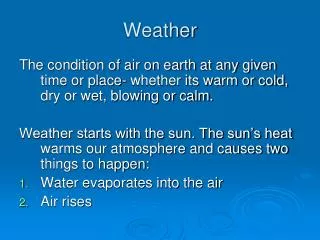
The Science of Weather • Meteorology is the study of weather and meteorologists are scientists who study and predict weather. • Weather is the state of the atmosphere at any given time and place. • Most weather takes place in the lower atmosphere which is the troposphere. • Weather occurs because our atmosphere is in constant motion.
What makes weather? • The Sun • Water • (in the air)
What does rain look like? • This remarkable evolution results from a tug-of-war between two forces: the surface tension of the water and the pressure of the air pushing up against the bottom of the drop as it falls. • When the drop is small, surface tension wins and pulls the drop into a spherical shape. • With increasing size, the fall velocity increases and the pressure on the bottom increases causing the raindrop to flatten and even develop a depression. • Finally, when the radius exceeds about 4 mm or so, the depression grows almost explosively to form a bag with an annular ring of water and then it breaks up into smaller drops
How does water get into the air? Add Heat Add Heat Liquid Water Vapor (It’s invisible!) Ice Remove Heat Remove Heat
Temperature • The measure of the average speed of air molecules. • The temperature of the air depends on the surface below.
Tornado • Form from Thunderstorms or Hurricanes • High Energy Density – effect small area • 75% United States
The Fujita scale, shown in red, measures the strength of a tornado based on the amount of damage it caused. This scale is used after the storm has passed and combines wind speed with the speed of sound. Dr. T. T. Fujita, University of Chicago
Hurricane • 40,000 time more powerful than tornado • 340 miles in diameter • June 1st - November 31st • August and September • Damage caused by wind, rain, and storm surge.
Thunder Storms • 40,000 occur each day throughout the world • Winds, tornadoes, flash flooding, and hail cause most damage.
Can we explain how the position of the earth in relation to the sun has an effect on seasonal weather changes? Weather changes every season because of the Earth’s tilt when it revolves around the sun.
How can we measure weather? • Thermometer (temperature) • Barometer • (air pressure) • Rain Gauge and SnowBoard (precipitation) • Anemometer • (wind speed) • Satellite (clouds)
Includes (1) wind-gauge, (1) rainfall sensor, (1) outdoor temp & humidity sensor, indoor measurement temperature/ humidity/ barometric pressure WWVB time display with manual setting • WWVB controlled calendar • Display of extensive weather data, in all cases with programmable alarm functions for certain weather conditions as well as records of all minimum and maximum values along with time and date of their recordings • Indoor and outdoor temperature and relative humidity display in degrees Fahrenheit or Celsius Indoor and outdoor relative humidity displays • Air pressure reading in inHg or hPa, absolute or relative • Detailed display of rainfall data in 1 hour, 24 hours, total since last reset in inch or mm • Wind speed in mph, km/h, m/s, knots or Beaufort • Wind direction display with LCD compass as well as numerical(e.g. 225 degrees) and abbreviated characters (e.g. SW) • Wind chill temperature display • Dew point temperature display • Weather forecast display by weather icons (sunny, cloudy, rainy) • Weather tendency indicator • Storm warning alarm • LED back light • COM port for easy connection to your PC • All the weather data from the base station and up to 175 sets of weather history data with user adjustable measuring intervals can be recorded and uploaded to your PC • Actual Size: 6.1 x 1.2 x 6.3in