What is geography?
What is geography?. the study of the earth and man’s interaction with it. The Five Themes of Geography. 1. location 2. place 3. human/environment interaction 4. movement 5. region. 1. Location. “Where is it?” absolute location – a place’s position on the globe

What is geography?
E N D
Presentation Transcript
What is geography? the study of the earth and man’s interaction with it
The Five Themes of Geography 1. location 2. place 3. human/environment interaction 4. movement 5. region
1. Location • “Where is it?” • absolute location – a place’s position on the globe • relative location – location of a place in relation to something else • hemisphere – half of the earth • latitude – imaginary lines that measure distance north or south of the equator (also called parallels) • longitude – imaginary lines that measure distance east or west of the Prime Meridian (also called meridians) - ends at the International Date Line 180° • grid system – network of lines used to find location
2. Place • “What is it like there?” • describes landforms, culture, history, language, religion, clothing, education, art, etc. • place is how you would describe an area to someone
3. Human-Environment Interaction • “What is the relationship between people & their environment?” • describes how the environment affects the people & how people affect the environment (pollution, use of resources, settlement patterns, conservation, adapting to the climate, etc.) • people adapting to or changing their environment • people’s activities within their environment
4. Movement • “How are people & places connected?” • describes why people move from one place to another & how they get around • concerned with the movement of three things: people, goods, ideas • interdependent – relying on one another for goods, services, and ideas
5. Region • “How are places alike?” (What common characteristics?) • a way to group & organize the world • 2 types of regions: 1. uniform region – an area with some common characteristic throughout (religion, language, climate, crops, etc.) Ex: The Middle East, The Sunbelt
5. Region Uniform Regions:
5. Region Uniform Regions: Sunbelt
5. Region 2. functional region – an area that functions together Ex: The Baton Rouge Metropolitan Area
Maps & Globes • A map is a flattened out portion of a globe. • The oldest known map is a Babylonian clay tablet created 2,500 years ago. • cartographer – map maker
Maps used to be made by manually observing, surveying, and recording information about a place.
By the 1940s, cartographers began to use aerial photography to aid in map making. • Now, we use satellites & computers to render images of the earth.
GIS (Geographic Information Systems) • stores geographic information in a digital database • users can select the layers of info they need & GIS creates a composite map
GPS (Global Positioning System) • developed for the military • uses 24 satellites, called Navstars, to beam info to the earth
Parts of Maps: TODALSIG • T = title • O = orientation • D = date • A = author • L = legend (key) – explains the symbols used on a map • S = scale – the relationship between measurements on a map to actual measurements on earth • I = index • G = grid
compass rose – directional marker on a map • cardinal directions – north, east, south, west • Globes are the most accurate representation of the earth, because allmaps are distorted in some way.
great circle path – shortest distance between two places on the earth’s surface
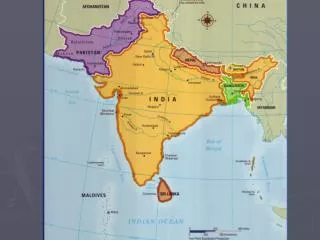
Types of maps: • physical – shows physical features like mountains, rivers, deserts, etc • political – shows the boundaries between countries, states, parishes, etc. • special purpose (thematic) – focuses on one aspect like population, religion, climate, land use, languages, etc.
Charts, Graphs & Diagrams • graph – a visual way of presenting information • bar graph – uses bars to compare data • line graph – reveals trends and relationships between data (shows changes over time)
Charts, Graphs & Diagrams (cont.) • circle graph (pie chart) – uses percentages to compare the parts to the whole • pictograph– uses pictures to present info • chart – shows facts arranged in columns & rows • diagram– shows what something is or how something is done
Create the best graph to represent each of the following sets of info: 1. Last week Mrs. Lipscomb gave 2 homework assignments. Mrs. Spence gave 3 homework assignments. Mrs. Devall & Mrs. Chaves each gave 1 homework assignment. 2. Of Mrs. Devall’s 30 students, 15 have brown eyes, 10 have blue eyes, and 5 have green eyes. (show percentages) 3. The number of students earning college scholarships has doubled every year, starting with 10 in 2004 and 160 in 2008.