Download
1 / 19
200 likes | 423 Vues
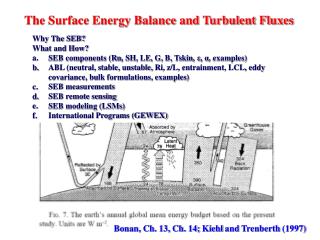
The Surface Energy Balance and Turbulent Fluxes. Why The SEB? What and How? SEB components ( Rn , SH, LE, G, B, Tskin , ε , α , examples) ABL (neutral, stable, unstable, Ri , z/L, entrainment, LCL, eddy covariance, bulk formulations, examples) SEB measurements SEB remote sensing

E N D
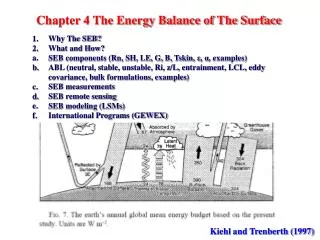
The Surface Energy Balance and Turbulent Fluxes • Why The SEB? • What and How? • SEB components (Rn, SH, LE, G, B, Tskin, ε, α, examples) • ABL (neutral, stable, unstable, Ri, z/L, entrainment, LCL, eddy covariance, bulk formulations, examples) • SEB measurements • SEB remote sensing • SEB modeling (LSMs) • International Programs (GEWEX) Bonan, Ch. 13, Ch. 14; Kiehl and Trenberth (1997)
The Atmospheric Boundary Layer ABL = The part of the troposphere that is directly influenced by the presence of the earth’s surface, and responds to surface forcings with a time scale of about an hour or less. See http://lidar.ssec.wisc.edu/papers/akp_thes/node6.htmhttp://apollo.lsc.vsc.edu/classes/met455/notes/section9/1.html
The Atmospheric Boundary Layer • Definition: ABL = The part of the troposphere that is directly influenced by the presence of the earth’s surface, and responds to surface forcings with a time scale of about an hour or less. • Structure: free atmosphere, entrainment zone, mixed layer (where U, θ, q almost constant with height), surface layer (where vertical fluxes of momentum, heat, and moisture are almost constant with height) • Thickness: typically 1 km; varying from 20 m to several km; deeper with strong solar heating, strong winds, rough surface, or upward mean vertical motion in the free troposphere. • Both structure and thickness have a strong diurnal cycle. • Turbulent motions (opposite to laminar flow) • chaotic swirls; rapid chaotic fluctuations in winds, temperature, moisture, other mass • generated mechanically (in the presence of strong near surface mean winds), or • generated thermally (strong solar heating high buoyancy vertical motion) • (mostly daytime, land; also common over the oceans) • ABL clouds: fog, fair weather cumulus, stratocumulus ,
Potential Temperature The potential temperature (θ) of a parcel of air at pressure P is the temperature that the parcel would acquire if adiabatically brought to a standard reference pressure P0 (= 1000 millibars). where T = the current absolute temperature (in K) of the parcel, R = the gas constant of air, and cp= the specific heat capacity at a constant pressure. See GPC Appendix C for derivations. θ is a more dynamically important quantity than T. Under almost all circumstances, θincreases upwards in the atmosphere, unlike T which may increase or decrease. θis conserved for all dry adiabatic processes, and as such is an important quantity in the ABL (which is often very close to being dry adiabatic). The dry adiabatic lapse rate: Γd = g/cp = 9.8 °C/km θis a useful measure of the static stability of the unsaturated atmosphere. stable, vertical motion is suppressed; unstable, convection is likely
Stüve diagram(Thermodynamic Diagram) • Isotherms are straight and vertical, isobars are straight and horizontal and dry adiabats are also straight and have a 45 degree inclination to the left while moist adiabats are curved (see also GPC Appendix C, Fig. C.1). • T=20°C, • P=1000 mb • θ= 20°C • T=20°C, • P=900 mb • θ= 28.96°C A parcel with P, T, q Td =? q*=?, RH=?, LCL=? Δq=?
Thermodynamics http://hyperphysics.phy-astr.gsu.edu/Hbase/heacon.html#heacon
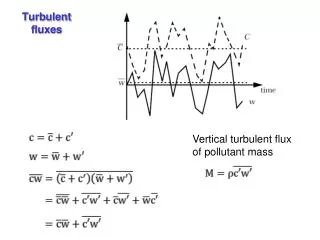
Air Flow and Turbulent Vortices Air flow can be imagined as a horizontal flow of numerous rotating eddies, a turbulent vortices of various sizes, with each eddy having 3D components, including vertical components as well. The situation looks chaotic, but vertical movement of the components can be measured from the tower.
Bulk Aerodynamic Formulas (Parameterizations) τ = ρCDM Ur2 SH = cpρ CDH Ur[Ts – Ta(zr)] LE = L ρ CDE Ur[qs – qa(zr)] CDN = [κ/ ln(zr/z0)]2 CDM = CDN,M fM(RiB) CDH = CDN,H fH(RiB) CDE = CDN,E fE(RiB) or Eqn (14.31) in Bonan (2008)
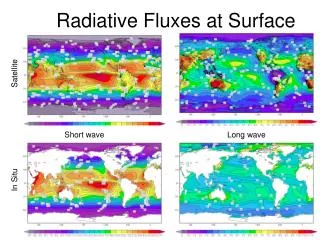
Global Distribution of Sensible Heat Flux http://www.cdc.noaa.gov/
Global Distribution of Latent Heat Flux http://www.cdc.noaa.gov/
Regional Patterns of The Surface Energy Balance West Palm Beach, Fl energy balance (ly/day) West Palm Beach, Florida is located in a warm and moist climate. Latent energy transfer into the air is greatest during the summer time which is the wettest period of the year, and when net radiation is the highest. During the summer, sensible heat transfer decreases as net radiation is allocated to evaporation and latent heat transfer. Yuma, AZ energy balance (ly/day) At the other extreme is Yuma, Arizona, a warm and dry climate. The most noticeable characteristic of this place is the lack of latent heat transfer. Though ample radiation is available here, there is no water to evaporate. Nearly all net radiation is used for sensible heat transfer which explains the hot dry conditions at Yuma.
Modeling of The Surface Energy Balance NCAR CLM: http://www.cgd.ucar.edu/tss/clm/ for global climate modeling and projections NCEP Noah LSM: for numerical weather predictions
Biogeochemistry Biogeophysics NCAR CLM 3.5 Hydrology Ecosystem Dynamics 2008 CCSM Distinguished Achievement Award Niu & Yang, 2003, 2006 Yang et al., 1997, 1999 Niu, Yang, et al., 2005 Niu, Yang, et al., 2007 Yang & Niu, 2003 Collaborators: UT (Z.-L. Yang, G.-Y. Niu, R.E. Dickinson); NCAR (G.B. Bonan, K. Oleson, D. Lawrence)
Noah LSM with hydrological enhancements Explicit diffusive wave overland flow Groundwater discharge, reservoir routing & Explicit channel routing Explicit saturated subsurface flow Collaborators: UT (Z.-L. Yang, G.-Y. Niu, D. Maidment), NCAR (Fei Chen, Dave Gochis); NCEP (Mike Ek, Ken Mitchell) Subgrid Disaggregation Dynamical Routing Methodologies • fully distributed flow/head • reservoir levels • distributed soil moisture • distributed land/atmo fluxes • distributed snow depth/SWE 1-D ‘Noah’ Community Land Surface Model
Observing The Surface Energy Balance FLUXNET http://www.fluxdata.org/default.aspx See also other flux measurement networks (e.g., Ameriflux, CarboEurope, Fluxnet Canada, and iLEAPS).
International Programs GEWEX http://www.gewex.org/