Download

1 / 27
270 likes | 395 Vues
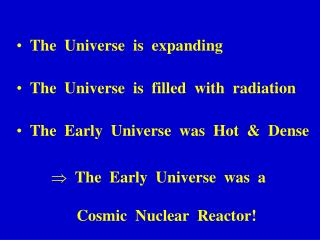
“Universe” of EG Submissions Trade and Environment Division 19 April 2010 (Update of the presentation delivered on 18 February 2010) For more information, please contact ludivine.tamiotti@wto.org.

E N D
“Universe” of EG Submissions Trade and Environment Division 19 April 2010 (Update of the presentation delivered on 18 February 2010) For more information, please contact ludivine.tamiotti@wto.org This document has been prepared under the Secretariat's own responsibility and is without prejudice to the positions of Members and to their rights and obligations under the WTO.
Caveats Submissions on Environmental Goods (EGs) covered in the presentation • By a group of 9 Members (9M): Canada, the European Union, Japan, Korea, New Zealand, Norway, Switzerland, Chinese Taipei and the United States – JOB(09)/132 (9 October 2009) • By Saudi Arabia (S) – JOB(09)/169 (6 November 2009) • By Japan (J) – TN/TE/W/75/Add.1 (16 February 2010) • By the Philippines (P) – JOB/TE/2 (16 February 2010) Trade Data (UN Comtrade Database): • Based on entire HS6-Lines • Nominal US$ Values in Time Series using Current Exchange Rates (and not Purchasing Power Parity – Rates) • Recording Errors and Evaluation Differences between reporting importing and reporting exporting countries • Data availability:2003: 94 WTO Members; 2004: 108 Members; 2005: 114 Members, 2006: 119 Members, 2007: 118 Members, 2008: 108 Members Tariff Data (WTO Integrated Database and ITC): • Simple („Tariff-Line-Weighted“) Averages that weigh all scheduled Applied MFN tariff lines equally – regardless of actual trade volumes Trade and Tariffs: • HS-Concordance – All EG submissions apply the HS2002 Revision, which currently is only used by 23 Members. The concordance to other Revisions may be imprecise, since many codes have no one-to-one relationship with HS2007 and HS1996 codes. • Australia, Canada, the EU27, Iceland, Japan, Liechtenstein, New Zealand, Norway, Switzerland and the USA are counted as „developed“.
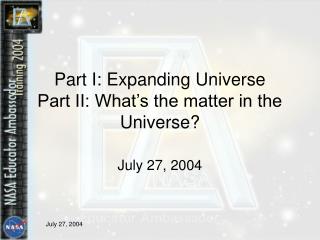
Universe of EGs: 384 HS6-Codes (HS2002)(+3 entries without HS6-Code from the HS2002 Revision) 9 Members (9M): 164 HS6-Codes 65 unique HS6 92 duplicates 9M/S 2 duplicates 9M/J 11 triplicates 9M/S/P 5 dupl.9M/P 49 unique HS6 170 unique HS6 1 unique HS6 Japan (J): 51HS6-Codes (+2 without codes) Philippines (P): 17 HS6-Codes Saudi Arabia (S): 262 HS6-Codes (+1 without HS2002-code)
Overlap between Lists(Number of overlapping HS2002-codes at the 6-digit-level)
Comparison Merchandise/EG-Trade 2003-2008(in Trillions of US$, All 4 Lists, Only Members with available Data, Source: UN Comtrade)
WTO Nominal Trade of EGs 2003-2008(in Trillions of US$, All 4 Lists, Only Members with available Data, Source: UN Comtrade)
Share of EGs in WTO Merchandise Trade 2008 (All 4 Lists, Only Members with available data, Data Source: UN Comtrade)
WTO Nominal Trade of EGs by List 2003-2008(in Billions of US$, All 4 Lists, Only Members with available Data, Data Source: UN Comtrade)
Top 15 Shares of EGs in National Merchandise Exports 2008(All 4 Lists, Data of 108 Members available, Data Source: UN Comtrade)
Top 15 Shares of EGs in National Merchandise Imports 2008(Compilation List, Data of 108 Members available, Data Source: UN Comtrade)
Top 15 WTO Exporters of EGs 2008 (in Billions of US$, All 4 Lists, Only available data, Data Source: UN Comtrade)
Top 15 WTO Importers of EGs 2008(in Billions of US$, All 4 Lists, Only available data, Data Source: UN Comtrade)
Top 15 WTO Annual Average Export Growth Rates 2003-2008(All 4 Lists, 94 WTO Members, Data Source: UN Comtrade)
Top 15 WTO Annual Average Import Growth Rates 2003-2008(All 4 Lists, 94 WTO Members, Data Source: UN Comtrade)
Exports Developing/Developed Members(in Billions of US$, Compilation List, Only available Member Data, Data Source: UN Comtrade)
Exports/Imports 2008 Developing/Developed (All 4 Lists, in Billions of US$, Only available Member data, Data Source: UN Comtrade)
Average MFN Tariffs 2009(All 4 Lists, Data Source: WTO Integrated Database and ITC)
Duty-Free Tariff Lines 2009(All 4 Lists, Data Sources: WTO Integrated Database and ITC)
Average MFN Tariffs 2009 by EG List(Data Sources: WTO Integrated Database and ITC, TL-Weighted Averages)
Duty-Free Tariff Lines 2009 by EG List(Data Sources: WTO Integrated Database and ITC)
“Universe” of EG Submissions Trade and Environment Division 19 April 2010 (Update of the presentation delivered on 18 February 2010)