Download

1 / 29
290 likes | 414 Vues
This paper explores the integration of nitrogen management in Oklahoma agriculture using the GreenSeeker remote sensing ground rig. Conventional nitrogen strategies, though profitable, often yield poor nitrogen use efficiency (NUE) due to excess mineral nitrogen and uniform field applications. By addressing temporal and spatial variability in nitrogen response, the study suggests in-season nitrogen estimation methods and variable rate applications to optimize yields and minimize waste. Ultimately, it emphasizes the need for precise management practices to enhance economic returns per acre.

E N D
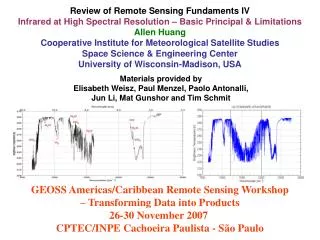
Nitrogen Applications with a Remote Sensing Ground Rig – The GreenSeeker G. V. Johnson, W. R. Raun, J.B. Solie, and M.L. Stone Oklahoma State University Stillwater, OK
Conventional Strategy is Easy and Profitable. Crop N requirement = 2 lb N/bu yield Average profit from N = $36/acre/yr
Poor NUE • Result of mineral N present at concentrations in excess of plant needs. • Soil-Plant system leaks in proportion to excess mineral N. • Excess N = f (yield potential, supply of non-fertilizer N. • Typically: • All fertilizer-N applied before crop needs any. • Entire field receives same rate.
Temporal variability • Uncertain yield potential
Temporal variability • Uncertain use (availability) of non-fertilizer N
Temporal variability (N Response; RI) • Range = 1.0 to 4.1 • Mean = 1.9 • CV = 38
90 N Preplant 45 N Preplant Solutions • Estimate N response in-season. RINDVI = 1.46
In-SeasonEstimatedYield (INSEY) NDVI at F5 = days from planting to F5, GDD>0 +Good predictor of final grain yield+Requires only one sensor reading+Work over different regions/biotypes Units: N uptake, kg ha-1 day-1 where GDD>0
Kenneth Failes, Cherokee, OK (March 20, 2002) RI = 0.60/0.57 = 1.1 Predicted yieldwith N fertilization(YPN) RI N-Rich Strip days from planting to sensing Predicted yieldwith no added Nfertilization (YP0) Planting date Farmer Check NDVI (sensing date) INSEY = (NDVI/days from planting to sensing where GDD>0)YPN = YP0 * RIFertilizer N = (Grain N uptake at YPN – Grain N uptake at YP0)/0.7
Economic estimates Average Gain = $17.13/acre/yr
Solutions • Measure and treat spatial variability
Solutions • Measure and treat spatial variability, in-season
Solutions • Measure and treat spatial variability, in-season
Solutions • Measure and treat spatial variability, in-season • Apply most N topdress
Output: Potential yield without N, potential yield with N, N fertilizer needed (1) NDVI collected from NRich Strip & Farmer Practice Enter: Max Yield for areaPlanting date, sensing date, NDVI values from (1) Procedure
http://www.soiltesting.okstate.edu/SBNRC/SBNRC.phphttp://www.dasnr.okstate.edu/nitrogen_usehttp://www.soiltesting.okstate.edu/SBNRC/SBNRC.phphttp://www.dasnr.okstate.edu/nitrogen_use
Solutions Must have “Qualified Engineer” to fix what “Agronomy Personnel” tear up
Topdress N Return ($/Ac) Obs. Treatment Preplant N Early Late Total N Yld (bu/a) 81 VRT 41 15 23 79 39.8 100 17 Farmer Check 52 21 20 92 34.6 82 2002 Field trials • 10 trials using 60-ft boom sensor-applicator. • Web site. • http://www.dasnr.okstate.edu/nitrogen_use/
What is Happening Now? • Field Scale Recommendations (Hand-held) • Ciudad Obregon, Mexio 10-2002, 108-2003 • Saraguro, Ecuador, 5-2002, 15-2003 • Oklahoma, 25-2002, >100 2003 Variable N Rate Applications Oklahoma 10-2001, 15-2002, >50-2003 Minnesota, 5-2002, >15 2003 Nebraska, 1-2001, 1-2002 (corn)