Download
1 / 42
420 likes | 564 Vues
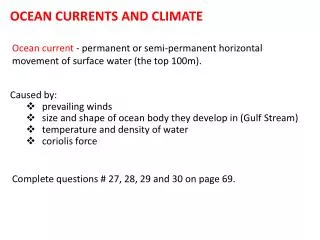
Special Interest Group Remote Sensing of the Coastal Zone. The Ocean and the Earth Climate. Rainer Reuter SIG Remote Sensing of the Coastal Zone Workshop Keynote, 07 June 2007. The Oceans. water hemisphere: 91% water coverage. land hemisphere: 51% water coverage.

E N D
Special Interest Group Remote Sensing of the Coastal Zone The Oceanand the Earth Climate Rainer ReuterSIG Remote Sensing of the Coastal Zone Workshop Keynote, 07 June 2007
The Oceans water hemisphere: 91% water coverage land hemisphere:51% water coverage http://oceancolor.gsfc.nasa.gov/cgi/biosphere_globes.pl
University of Sheffield http://www.worldmapper.org
University of Sheffield http://www.worldmapper.org Land area Hazards: floods Deads due to floodsin 1975-2000
University of Sheffield http://www.worldmapper.org Land area Hazards: storms Deads due to stormsin 1975-2000
University of Sheffield http://www.worldmapper.org Land area Economy: fishing Net exports of fish
University of Sheffield http://www.worldmapper.org Land area Climate: CO2 CO2 emissions in 2000
University of Sheffield http://www.worldmapper.org Land area Climate: CO2 Decrease of CO2 emissionsbetween 1980 and 2000
University of Sheffield http://www.worldmapper.org Land area Climate: CO2 Increase of CO2 emissionsbetween 1980 and 2000
The oceans: climate induced processes • Increase in temperature • Sealevel rise • Currents • Loss of sea ice • Wind, hurricanes • Carbon dioxide storage • Acidification
The oceans: climate induced processes • Temperature • Sea level rise • Currents • Sea ice • Wind, hurricanes, floods • Carbon dioxide storage • Acidification, coral reefs
0 5 10 15 20 25 30 Temperatur in °C • Temperature Sea surface temperature maps http://www.ssec.wisc.edu/data/sst/
Temperature Mean lower atmosphere (land & ocean) anomaly relative to 1951-1980 http://data.giss.nasa.gov/gistemp/ Annual mean T / °C 5-year mean year
Temperature Mean anomaly of the near-surface ocean relative to 1961-1990 Intergovernmental Panel on Climate Change 2001 T / °C year
T / °C annual mean 5-year mean year • Temperature Lower atmosphere vs near-surface ocean
Temperature Lower atmosphere temperature changes Hansen et al., JGR, 2001 Arctic shows highest variability T /°C
Temperature Lower atmosphere temperature changes Upper ocean temperature changesin 2001-2005 relative to 1870-1900 Hansen et al., PNAS 2006 T /°C
Temperature Climate forcings of radiative imbalancefrom 1750 to 2000 W/m2 1,85 W/m2from measured data Hansen et al., JGR, 2005
Temperature Climate forcings in the NASA GISS climate model 1,0 W/m2 +0,7°C Atm.+0,4°C Ocean ? 0,85 W/m2 are still„in the pipeline“ Hansen et al., Science, 2005
·1022 J ·1022 J 0-300 m 0-700 m 0-3000 m • Temperature The excess energy remains in the near-surface layer! Levitus et al., GRL, 2005 Increase in the surface layer: +0,4°C Average in the water column: +0,04°C in 1955-1998
Temperature Uptake of excess energy from 1955 to 1998 ·1022 J 84%! Levitus et al., GRL, 2005
Sealevel rise 2080-2099 relative to 1980-1999 IPCC WG1 2007
Sealevel rise 2080-2099 relative to 1980-1999 due to ocean density & circulation Scenario A1B IPCC WG1 2007
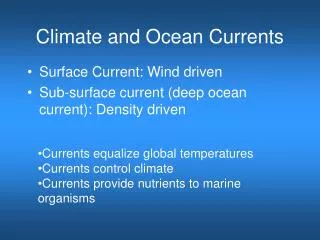
Currents Near-surface waters
Currents The conveyour belt Broecker W S (1991) Oceanography, 4, 79-89 http://www.ciencia.cl/CienciaAlDia/volumen4/numero2/articulos/articulo6.html
Currents Outflow from the Arctic through the Greenland Sea! The formation of sea icein the Arctic causes the arctic convergencein the Greenland Sea... UNEP/GRID-Arendal
Sea ice Sea ice volume until 2100: results of the model HadCM3 http://www.metoffice.com/research/hadleycentre/
Carbon dioxide Mauna Loa, Hawaii:http://www.mlo.noaa.gov/ Zeitserie des CO2in der Atmosphäre seit 1959
Carbon dioxide Carbon inventory CO2 reservoirsin 109 to Transport in 109 to/year http://www.metoffice.com/research/hadleycentre/
Carbon dioxide Standing stock CO2 reservoirsin 109 to Transport in 109 to/year http://www.metoffice.com/research/hadleycentre/
6.6 • Carbon dioxide Anthropogenous inputto the atmosphere CO2 reservoirsin 109 to Transport in 109 to/year http://www.metoffice.com/research/hadleycentre/
6.6 • Carbon dioxide 3.4 Accumulationin the atmosphere CO2 reservoirsin 109 to Transport in 109 to/year http://www.metoffice.com/research/hadleycentre/
1.2 2 6.6 • Carbon dioxide 3.4 Accumulation in the biosphere CO2 reservoirsin 109 to Transport in 109 to/year http://www.metoffice.com/research/hadleycentre/
1.2 2 6.6 • Carbon dioxide 3.4 Accumulation in the biosphere Turnover timeis 10 years Turnover time is 0,06 yearsor 3 weeks http://www.metoffice.com/research/hadleycentre/
Carbon dioxide Net ocean-atmosphere export in mol/(m2·year) in 1995 Integral: -2,2(±0,4)·109 to Feely et al., Oceanography 14(4) 2001