Understanding Line Graphs: Creating and Interpreting Temperature Changes
This guide explores the creation of line graphs to illustrate temperature changes throughout a day. It distinguishes between line graphs and bar graphs, explaining when to utilize each type. The content covers axis definitions, the importance of equal intervals, and how to appropriately label axes. Practical exercises are included to help reinforce understanding and encourage independent graph-making. Engage with real-life examples, such as tracking temperature or rain, to better grasp the concept. Learn how to effectively convey change over time using visual aids.


Understanding Line Graphs: Creating and Interpreting Temperature Changes
E N D
Presentation Transcript
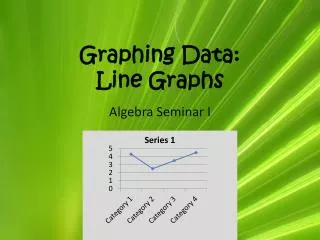
Today I want you to help me make a graph. • I want to make a graph that shows the change in temperature throughout the day yesterday. • What kind of graphs could we make to show this?
Bar Graph vs Line Graph • What is the difference between a bar graph and a line graph?
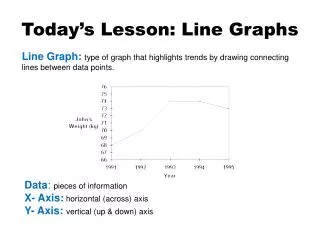
Line graphs-A graph used to show change over time. What can time be measured in??? Seconds - Minutes - Hours – Days - Weeks - Months – Years - Decades - Centuries - etc.
When to use a line graph? Would we use a line graph in the following situations: • To show how many people like pizza in this class? NO • To show how much it rained each month this year? YES- because months and years deal with time. To show how many people go to Friendly’s on Friday? NO
Birthdays? • Would we use a line graph to show when our birthdays are? • Our birthday does deal with time doesn’t it? (months/years) • But, our birthday is constant, meaning it never changes. • A line graph shows change in time,so we would not use it for this type of graph.
Y X How do we make a line graph? • A line graph ALWAYS has a title! • A line graph has two different axis’s • An axis is either the horizontal line (called x) or the vertical line (called y) that form the base lines of a graph.
Vertical Y X (Horizontal YOU TELL ME…. What color is the y-axis? What color is the x-axis?
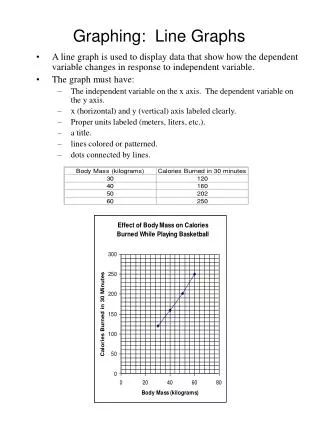
X-axis and Y-axis • When you are making a line graph, the x-axis is always horizontal, and the y-axis is always vertical. • The x and y-axis usually starts with zero on a line graph • It is important to make sure that the intervals on our y-axis are always equal. • What do I mean by this?
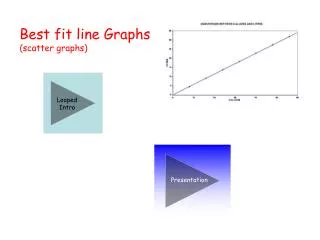
Intervals • When we are setting up a line graph, we need to decide what intervals we want to use. • If we are graphing the temperature for a year, do we want to put 365 days on the graph, and 100 different temperatures? • When we see a horizontal flat line, that means that there was no change during a specific time period.
Time in minutes Plotting a Line graph • When we are plotting a line graph, it is important to read what information is on each axis. • There must be a label on each axis that describes the information. • Put the time on the X (horizontal axis). Put what’s changing on the Y (vertical axis).
Practice With Graphs • Please study the graphs that you have and answer the questions. • Then we will discuss the your answers.
Make your own….. • Now that you have had time to interpret graphs, I would like you to make your own graphs. • Remember to read the information carefully and label everything!
Mr. Mamula’s Height Mr. Mamula’s Age