Download
1 / 8
80 likes | 98 Vues
Explore Texas voter turnout statistics, trends over 20 years, and effective strategies to mobilize voters, as per League of Women Voters data. Find resources for voter education and best practices for increasing civic engagement.

E N D
Voter Turnout Overview2016 Results League of Women Voters of Texas Elizabeth A. Erkel, PhD June 15, 2017 Data sources available upon request.
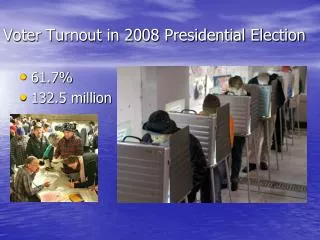
aVoting eligible population (VEP) = Voting age citizens not serving punishment for a felony. b Voting age citizens (VEP not available for Texas in 1996). c Among the voting eligible population, the turnout increased 8.5% over 20 years (51.7% vs. 60.2%).
Highest & Lowest Voter Turnout (% VEP*) States, November 2016 Minnesota Maine New Hampshire Colorado Wisconsin Arkansas Tennessee Texas West Virginia Hawaii *VEP = Voting eligible population
Voter Turnout Rate (% VEP*), United States & Texas, November 2008-2016 *VEP = Voting eligible population
Voter Turnout Rate (%), by Defined Population, U.S., Presidential Elections, 1940-2016 64 62 63 52 56 49
Voter Registration Rate (% VEP*), United States and Texas, November 2008-2016 *VEP = Voting eligible population
Voter Registration & Turnout Rates (% VEP), by Geographic Area, November 2016 The gap in turnout Voting eligible population (VEP) = voting age population adjusted for noncitizens and felons ineligible to vote.
LWV-Texas GOTV Resources • Voter education materials • my.LWV.org/Texas/Get-Out-Vote-0 • Presentations • Bookmarks, brochures, graphics • Social media content • How to educate and mobilize voters • my.LWV.org/Texas/Best-Practices-GOTV • Best practices • Tactics that work • What to say • Engaging target populations