
Objectives
The influence of premenopausal hysterectomy on bone mineral density Dalia F Abdulwahab 1 , Reyad Al-Baldawy 2 , Mohammed Chabek 3 , Mokhtar Awang 1 , Noraziana Abd Wahab 1 , Muna Al-Kubaisi 1

Objectives
E N D
Presentation Transcript
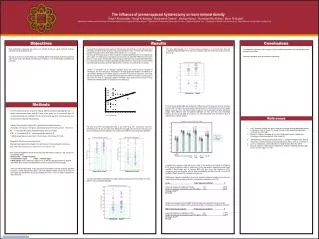
The influence of premenopausal hysterectomy on bone mineral density Dalia F Abdulwahab1, Reyad Al-Baldawy2, Mohammed Chabek3 , Mokhtar Awang1 , Noraziana Abd Wahab1, Muna Al-Kubaisi1 1Department of Obstetrics and Gynecology, International Islamic University Malaysia, Pahang, Malaysia. 2Department of Obstetrics and Gynecology, University of Baghdad, Baghdad, Iraq . 3Department of Obstetrics and Gynecology, Al – Elwiya Maternity teaching hospital, Baghdad, Iraq. Objectives Results Conclusions Premenopausal hysterectomy. Had no impact on bone mineralization parameters even after adjusting for the duration of menopause. Keywords: menopause, bone mineral density, hysterectomy Bone mineralization parameters are known to be affected strongly by ovarian hormones. Estrogen deprivation can cause rapid bone loss. The purpose of this cross sectional study is to investigate whether premenopausal hysterectomy adversely affect ovarian function by inducing early menopause, reflected by bone mineralization parameters and bone mass. The results shown were based on the analysis of 25 female cases with past history of total hysterectomy and complaining of hot flashes (mean duration of menopausal symptoms is 5.3 +/- 2.7 years) and a control group of 40 postmenopausal women (mean duration of menopause is 3.7 +/- 2.6 years). The mean age of the study group (51 years of age) was not significantly different from the control group (52 years of age). The median parity of the cases group (3) was also not significantly different from the control group (3). in both groups. The mean BMI of the cases group (28.5 kg/m2) was not significantly different from the control group (27.6 kg/m2). Finally no statistically significant difference in mean duration of breast feeding history was observed between cases with hysterectomy (13.8 months) and control group (14.3 months). The t-score ranged between -1.7 to 1.5 among controls and between -1 to 1.3 among cases. There was no statistically significant difference in mean t-score between cases with hysterectomy (0.36) and control group (0.36). Duration of menopause can be assessed objectively among the control group By cessation of menstruation, but not the study group. Assessment for the study group By the duration of hot flashes as an approximation, although this is a specific symptoms, but in fact may not equal to amenorrhea. In this study the serum FSH was taken as a surrogate marker that reflects the duration of menopause in both groups. It was shown that there is a statistically significant moderately strong positive linear correlation (r=0.32) between serum FSH and duration of menopause in the control group Hysterectomy Controls Methods The bone mineral density (BMD) was measured in 6 different areas of the femur and hip bone. In general the mean BMD was higher among cases with hysterectomy than the control group by an amount ranging between as low as 1.9% in the femoral shaft to as high as 4.8% in the greater trochanter and Ward's triangle. These differences were not significant statistically and even when they were exceptionally significant as the case with BMD of the femoral neck and intertrochantric area they were too small in magnitude to be of clinical relevance • This cross sectional study was conducted in Al-Elwiya Maternity teaching hospital, Baghdad, Iraq Forty healthy postmenopausal women aged 45-60 years (control group) and 25 women who have had previous hysterectomy with conservation of both ovaries before the age of 45, and at least 2 year up to 5.5 years before the study (for benign reasons) • All women were subjected to questionnaire to determine the menopausal symptoms • The duration of menopause in both groups. Calculated by using S.FSH and S.E2 and not amenorrhea. • S.E2 was measured by pg/ml, and postmenopausal value up to 14 pg/ml. • S.FSH was measured by Iu/L, postmenopausal value more than 40 • S. alkaline phosphatase (Iu/L) as a marker of bone formation. Normal range 30-100 Iu/L. • Demographic data and bone mass measurements. • Body height was measured to the nearest 0.1cm with the patient in the erect position without shoes • Body weight with indoor clothing, but without shoes, to the nearest 0.1 Kg. • Bone mineral density(BMD) of the left proximal femur was determined in 6 region by dual energy X- ay absorptiometry (DXA) Femoral neck Greater trochanter • Intertrochanteric region Shaft Total hip region • Wards triangle: which is defined as a square of 1X1 cm with the lowest density within the proximal femur [Which is the most important area because it is the first area where bone lose appear] • Even when well matched females, for age and parity, are scanned they exist wide variation as guided by the theory of natural distribution by poysson, that is why statistical analysis was done in the form of T scores which are determined by the computer supplied with device. T score, is utilized in research with small sample size References • Joel S. Finkelstein, Sarah E et al. Bone mineral density changes during the Menopause transition in a Multiethnic cohort of Women. The Journal of clinical Endocrinology& Metabolism March 1,2008 vol. 93 no.3 861-868 • Michael E.L. Paterson, Menopause and Hormone Replacement Therapy: (Obstetric and Gynecology, an Evidance-based text),, 2004, chapter 56 • 3.Nanette Santoro; Alan Attman; David pharmacology, J.; Christopher Callagher; Susan Wyscoki. The promise of hormonal replacement therapy Contemporary Obstet. Gynecol. June 2000; 2-22. • 4. Lane et al. Osteoporosis. Clinical orthocedic and related research. 2000; 372: 139-48. • 5. Nuala, W.; Michael, D. Oophorectomy at hysterectomy. Progress in Obstetrics and Gynecology, volume 14, 2000, chapter 17, P. 244. The mean serum FSH was significantly higher in the control group (78.1 miu/ml) than cases with hysterectomy (70.7 miu/ml). The mean serum Estradiol E2 was slightly lower among the control group (7.2 pg/ml) compared to cases with hysterectomy (7.8 pg/ml), but the difference was not significant statistically. Hysterectomy Controls Greater Trochanter intertrochantric femur femur Ward’s total hip neck shaft triangle • A multiple linear regression model was used to control for the duration of menopause as reflected by S.FSH, before assessing the effect of hysterectomy on bone mineralization parameters (namely t-score and BMD of Wards triangle, which is the lowest BMD in the femur bone). After adjusting for S.FSH, hysterectomy group was associated with very small and statistically insignificant increase in t-score(0.03) and BMD of Ward’s triangle(0.02) compared to control group • Multiple linear regression model with t-score as the dependent (response) variable showing the case-control difference after controlling for duration of menopause as reflected by serum FSH. • t-score Partial regression coefficient P • Cases with hysterectomy compared to controls 0.03 0.92[NS] • Duration of menopause as reflected by serum FSH (pg/ml) 0.004 0.68[NS] • P (model) = 0.92[NS] • R2 = 0.003 • Multiple linear regression model with BMD of Ward's triangle as the dependent (response) variable showing the case-control difference after controlling for duration of menopause as reflected by serum FSH. • BMD of wards triangle (mg/cm2) Partial regression coefficient P • Cases with hysterectomy compared to controls 0.02 0.17[NS] • Duration of menopause as reflected by serum FSH (pg/ml) -0.0006 0.37[NS] • P (model) = 0.17[NS] • R2 = 0.06 The mean serum Alkaline phosphatase was slightly lower(79.5) among cases than controls(87.2), but the difference was not significant statistically. Hysterectomy Controls Hysterectomy Controls Hysterectomy controls


