
Uploaded by
brier
11 SLIDES
281 VUES
110LIKES
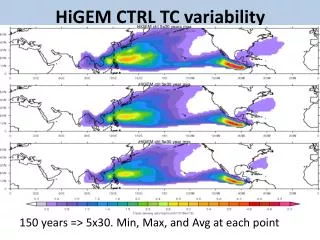
HiGEM CTRL TC variability
DESCRIPTION
HiGEM CTRL TC variability. 150 years => 5x30. Min, Max, and Avg at each point. HiGEM CTRL TC frequency. Atl Additional obs are 1851-2010, 1944-2010, 1966-2010, 1981-2010, 1995-2010 From Blake (2010). Change in track densities with increased CO 2.
Download
1 / 11
Télécharger la présentation 
HiGEM CTRL TC variability
An Image/Link below is provided (as is) to download presentation
Download Policy: Content on the Website is provided to you AS IS for your information and personal use and may not be sold / licensed / shared on other websites without getting consent from its author.
Content is provided to you AS IS for your information and personal use only.
Download presentation by click this link.
While downloading, if for some reason you are not able to download a presentation, the publisher may have deleted the file from their server.
During download, if you can't get a presentation, the file might be deleted by the publisher.
E N D
Presentation Transcript
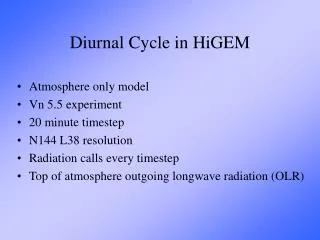
HiGEM CTRL TC variability 150 years => 5x30. Min, Max, and Avg at each point
HiGEM CTRL TC frequency Atl Additional obs are 1851-2010, 1944-2010, 1966-2010, 1981-2010, 1995-2010 From Blake (2010)


More Related