Download
1 / 9
90 likes | 225 Vues
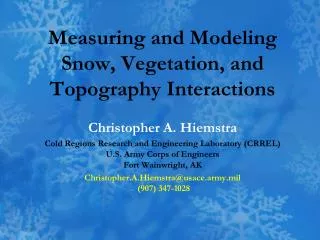
Measuring and Modeling Snow, Vegetation, and Topography Interactions. Christopher A. Hiemstra Cold Regions Research and Engineering Laboratory (CRREL) U.S. Army Corps of Engineers Fort Wainwright, AK Christopher.A.Hiemstra@usace.army.mil ( 907) 347-1028.

E N D
Measuring and Modeling Snow, Vegetation, and Topography Interactions Christopher A. Hiemstra Cold Regions Research and Engineering Laboratory (CRREL)U.S. Army Corps of EngineersFort Wainwright, AK Christopher.A.Hiemstra@usace.army.mil (907) 347-1028
Intensive Observations Inform Modeling • Fine- and coarser-scale sampling regime • What factors are important in modeling snow distribution and how can those factors be incorporated into models and be used for validation?
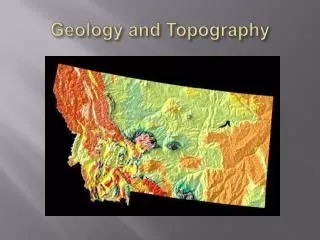
Models MicroMet(Liston and Elder 2006a) produces high-resolution meteorological data distributions of air temperature, RH, wind speed and direction, surface pressure, incoming solar radiation, incoming longwave radiation, and precipitation. Topography and Met Data Locations Air Temperature
Models SnowModel: A Spatially Distributed Snow-Evolution Modeling System (Liston and Elder 2006b) EnBal– Surface Energy Balance/Melt Model (Liston et al. 1999) SnowPack– Snowpack Model (Liston and Hall 1995 ) SnowTran-3D– Blowing and Drifting Snow Model (Liston and Sturm 1998; Liston et al. 2007) SnowAssim– Snow Data Assimilation Model (Liston and Hiemstra 2008)
Simulations The red boxes indicate previous simulation efforts, the blue boxes indicate current efforts.
Terrestrial Pan-Arctic Simulations (1979-2009) • Liston and Hiemstra 2011 (J Clim., in press) • 7250-km by 7250-km domain • MERRA atmospheric forcing • 2/3° longitude by 1/2° latitude global grid • hourly time-step • Used Micromet to regrid to 10 km and 3 hourly time-step. • Land Cover Distribution. • Derived from 300 m resolution Global Land Cover (GlobCover) and Walker et al.’s (2003) Circumpolar Arctic Vegetation Map, CAVM • To improve map clarity, some classes were grouped
30-year average, 10-m air temperature, when snow was on the ground (°C). Trend in 10-m air temperature (°C decade-1) when snow was on the ground. Area- and yearly-averaged 10-m air temperature, when snow was on the ground for the 250-km by 250-km Alaska box (c) or Canada box (d)
30-year average total annual snow precipitation when snow was on the ground (cm) Trend in total annual snow precipitation (cm decade-1) when snow was on the ground. Area- and yearly-averaged total annual snow precipitation when snow was on the ground for the 250-km by 250-km Alaska box (c) or Canada box (d)
30-year average core-season snow duration when snow was on the ground (days) • The core snow season is defined to be the longest period of continuous snow cover in each year • Trend in core-season snow duration (days decade-1) when snow was on the ground. • Area- and yearly-averaged core-season snow duration when snow was on the ground for the 250-km by 250-km Alaska box (c) or Canada box (d)