Download
1 / 10
100 likes | 238 Vues
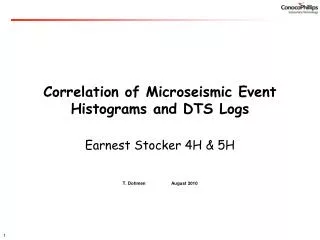
Correlation of Microseismic Event Histograms and DTS Logs. Earnest Stocker 4H & 5H. T. Dohmen August 2010. Event Histogram & Production logs. Stages 2-10. Stages 2-7. Stage1. Stage1. *. * Stage 8 is an Upper Barnett Shale completion. 5H Well. 4H Well.

E N D
Correlation of Microseismic Event Histograms and DTS Logs Earnest Stocker 4H & 5H T. Dohmen August 2010
Event Histogram & Production logs Stages 2-10 Stages 2-7 Stage1 Stage1 * * Stage 8 is an Upper Barnett Shale completion. 5H Well 4H Well DTS are the Distributed Temperature Sensor Logs run from campaigns 1 & 2 in both treatment wells. Showing events from each well’s stimulations
Selecting Events Within 500 ft of Wellbore Orange is all 4H events, blue are those within 500ft of the wellbore. Note: 5H events would add insignificantly to this view as seen in lower map. Green= only 5H events, yellow are all events within 500ft of the 5H wellbore. We see that there is a potential contribution from some of the 4H completions to the 5H well. We don’t know how many of these connect to 5H fracs, but they could contribute partially to production in the heel of the 5H. The yellow histogram (left) includes all points within the oval. Points are displayed to see the contribution from the 4H completions. Yellow are meq’s from 4H completions within 500 ft of the 5H borehole..
Event Histogram & Production logs Stages 2-10 Stages 2-10 Stage1 Stage1 Only Events from 5H Stages 5H: All Events in +/-500ft Some events from 4H completions may have contributed to the 5H production. That is, some portion of the difference between the yellow and green histograms may represent connected network perm that could account for the discrepancy between production and event histograms.
Test Even Closer Within 500ft Within 300ft Within 150ft
Event Histogram & Production logs Stages 2-10 Stages 1-10 Stage1 Closer Events All Events in +/-500ft “Closer Events” are from the final HiPoint dataset culled for distances less than 500ft(blue), 300ft(red), and 150ft (purple).
Test Projection: N 88 degrees E Closer events are from the final HiPoint dataset culled for distances less than 500ft(blue), 300ft(red), and 150ft (purple) are here projected at 88degrees east to show a better match to the production picture. Could it be that near wellbore connections are somewhat offset instead of perpendicular? Stress changes introduced by the presence of the wellbore should cause fractures to initially develop longitudinally near the wellbore. Could this cause an offset in how fracs connect? Stages 1-10 Closer Events
One step too far? • Projecting at 104 degrees
What about the 4H? • All less than 150ft. 66 degrees looks best here. ES #4H