Download
1 / 102
1.05k likes | 1.34k Vues
Implementing Continuous Process Improvement in Our Schools. Kaizen Event Training. Compete for funding. Compete for talent. Compete for students. Compete for community growth and quality of life. Compete for the “hearts and minds” of the general public. Do more with less…. Expand Services

E N D
Implementing Continuous Process Improvement in Our Schools Kaizen Event Training
Compete for funding. Compete for talent. Compete for students. Compete for community growth and quality of life. Compete for the “hearts and minds” of the general public. Do more with less…. Expand Services Improve Student Performance Meet Increasing Public Goals Keep Students in School Meet Workplace Requirements Education’s Challenge
CRCSD’s Response • Established Strategic Plan focused on Customer Satisfaction and Continuous Improvement. • Vision, mission, values, goals and guiding philosophy of each department are aligned.
Business TransformationGrowth Opportunities • Increased responsiveness • Provides flexibility to meet changing customer needs without backlog • Improves satisfaction of delivery of services • Improves quality & reliability • Builds customer trust & loyalty • Gives a competitive advantage that is hard to match quickly
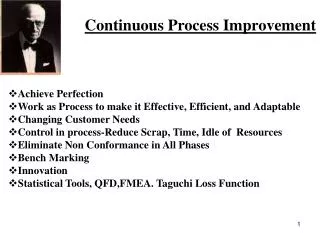
What is Lean? • Lean as a business philosophy refers to a way of thinking that focuses on waste elimination. • “Waste” describes the elements of a process that add no value to the service or product required by the customer. • Lean thinking demands an organizational culture that is intolerant ofwaste in all forms. All steps in a process can be categorized as waste or value added.
Principles of Lean Thinking • Precisely define value from the customer's perspective • Identify the value stream for each process • Allow value to flow without interruptions • Let the customer pull value from the process • Continuously pursue perfection
Lean Thinking • Lean Thinking is based on • Simple but powerful tools • Engages the creativity of the people doing the work • Rapid process improvement • Teaches people to see waste
Lean Culture • Continuous improvement focus • Bias for action • Creativity before capital • Total employee / stakeholder involvement
What Is Lean Education Transformation? • Focusing on lead-time reduction to improve responsiveness • Achieving simultaneous improvements in quality, cost, and delivery • Leveraging improvements for competitive advantage • Building a continuous improvement culture to sustain the gains • Deploying Kaizen Methodology for rapid transformation
Business Process Kaizen(Change – Better) Kaizen Breakthrough Methodology
Kaizen Team Ground Rules • Keep an open mind to change • Maintain a positive attitude • Never leave in a silent disagreement • There is no rank or position • Create a blameless environment • Practice mutual respect every day • Treat others as you want to be treated • One person, one voice—no position or rank • There’s no such thing as a dumb question • Understand the process and Just Do It!
Kaizen BreakthroughMethodology Principles • Clear objectives • Team process • Tight focus on time • Quick & simple • Necessary resources immediately available • Immediate results (new process functioning by end of week) • 5S “mindset”, use the steps to support the event activities
Pre-work Define Obtain Current Data • Provide information for the sponsor and guidance team members to evaluate scope and objectives • Provide information and data as a starting point for the team
Event Roles • Facilitator – Guides the kaizen process • Team Leader – Understands the kaizen process and guides the team • Sub-team Leader – Understands the business process under study and assists team leader • Team Participants – Make the improvements
Kaizen Methodology • Is focused on lead-time and variation reduction • Is measurement focused • Is data driven, and fact based • Provides a baseline for future improvements (Kaizen) • Drives cultural change
Quality & Time • Cost & Time • Delivery & Time • Safety & Time Time-Based Impacts on Processes and Delivery of Services
Steps to ImplementingBusiness Transformation • Create a business process map to identify areas of opportunity
What is a BusinessProcess Map? A tool used to: • Display the current process and information flow from the customer request through the delivery of the service to the customer • Identify opportunities and establish project priority • Identify and set the vision for the future state Business Process Map.
Steps to ImplementingBusiness Transformation • Create a business process map to identify areas of opportunity • Identify value adding and non-value adding activities and set new performance targets
Value-Add vs. Non-Value-Add Definitions Value-Adding Activities… ...transform materials and information into products & services which the customer wants. Non-Value-Adding Activities... …consume resources, but don't directly contribute to the product or service…waste!
Categories of Waste • Production ofDefects • Overproductionahead of demand • UnnecessaryTransportof materials • Waitingfor the next process step • Inventories(Excess material/information) • UnnecessaryMovementby employees • Over Processing due to poor tools and product design Lead time reduction is achieved by identifying and eliminating waste.
Causes of Waste • Functional Organization • Technology Gaps • Excessive Controls • Dated Process Design • No Back-up/Cross Training • Unbalanced Workload • Batching of Forms / Applications • Data Entry Batching • Changing Government • Practices and Policies • No Decision Rules • Poor Visual Control • Disorganized Workplace • Lack of Training • Obsolete Forms or Form Design • Poor Layout • Government Regulations w/ • Ambiguous Interpretation
Value-Add vs. Non-Value-Add Definitions Value-Adding Activities… ...transform materials and information into products & services which the customer wants. • “Customer” must be willing to “pay” for it. • Must transform the product or service in some way. • Must be done correctly the first time.
Value-Add vs. Non-Value-Add Definitions Non-Value-Adding Activities... …consume resources, but don't directly contribute to the product or service…waste (muda) ! • Type 1 – Business necessary – does not add value but we do not know how to eliminate it right now. • Type 2 – Unnecessary.
Improvement Objectives • ELIMINATE Type 2 Non-Value Added steps • REDUCE Type 1 Non-Value Added steps • OPTIMIZE Value Added
Waste and its two cousins! • Muda – Waste – divided into seven types. • Mura – Unevenness – consists of all resources that are wasted when quality cannot be predicted (testing, inspection, rework, returns, unscheduled travel, etc). • Muri – Overburden/overdoing – unnecessary or unreasonable overburdening of people, equipment or systems.
Categories of Waste • Production ofDefects • Overproductionahead of demand • UnnecessaryTransportof materials • Waitingfor the next process step • Inventories(Excess material/information) • UnnecessaryMovementby employees • OverProcessingdue to poor tools and product design Lead time reduction is achieved by identifying and eliminating waste.
Defects • Internal or external suppliers providing incomplete or incorrect information or material. • Evidence: CAC: Correcting information that has been supplied. Adding missing information that should have been supplied. Clarifying information that should have been clear when supplied. Material that does not work. Handling customer complaints. • Risks: Errors become defects that require rework. Produces dissatisfied customers, frustrated workers, lost productivity, and extended lead times. Make decisions based on incorrect or incomplete data.
Overproduction • Producing too much, too fast or too soon. • Evidence: Build up of work-in-progress (WIP) between process steps. Build up of queues, people waiting, filled in-boxes or email queues, etc. • Risks: Excessive lead times. Unnecessary complexity and confusion due to reprioritization of tasks and the development of multiple tracking systems.
Transportation • Movement of “things” – paperwork, electronic information, material, drawings, equipment, and supplies. • Evidence: Hand carrying. Traveling to shared equipment. Searching for information; seeking information clarification. Searching for material. • Risks: Damage or loss during transport. Delay in work being available.
Waiting • People waiting for people. Information, product, or equipment waiting for people. People waiting for information. Product, or equipment. Idle time created when • Evidence: “The Thing” passing through the system stops. Idle people. Idle bottleneck equipment. Waiting for meetings to begin. Waiting for information, input, decisions, approvals or authorization to proceed. • Risks: Extended lead times, long work days, and paid overtime. Unnecessary capital expenditures for equipment.
Inventories/WIP • Excess paperwork, supplies, materials, equipment, etc. Work waiting in que. Work partially completed. Work completed but not utilized. • Evidence: Stockpiles of supplies, forms, materials, etc. Disorganized storage areas. • Risks: Reduced cash flow. Lost productivity due to searching. Excess space. Damage. Obsolescence.
Movement • Movement of people. • Evidence: Hand carrying work product. Functional layout. Traveling to shared equipment. Searching for information; seeking information clarification. Excess reaching, repositioning, stacking. Not car-pooling. Meeting face-to-face instead of teleconferencing. • Risks: Reduced capacity to perform value-adding work, which results in increased staffing requirements. Injury.
Over Processing • Doing more to anything than the customer is willing to pay for. Effort that adds no value from the customers point of view. • Evidence: Inspections, audits, and reviews.. Redundant task. Duplicate data entry. rewriting, etc. Too many handoffs. Multiple approvals/signatures. Unnecessary meetings. • Risks: Excessive lead times. Low productivity. Frustrated workforce.
R&C log into data base Review packet for complete-ness Is the project required? Submittal Complete? Assign R&C number Date stamp mail Prepare file Open mail Y Y N N Call applicant Assign previous number & pull file Request update info. & set file aside Lead time = 8 hrs. Value Add time = 5.5 minutes Value Add % = = 1.1% 5.5 min. 8 hrs. x 60 min. Value Adding by Process:Submittal of Application 5 hrs. 3.0 hrs. 30 sec. 5 mins.
Steps to ImplementingBusiness Transformation • Create a business process map to identify areas of opportunity • Identify value adding and non-value adding activities and set new performance targets • Create process flow
Enhanced Spaghetti Map • Shows information flow • Shows staff flow • Aids in identifying wasteful activities by viewing it from the basis of physical layout • Shows what is actually happening versus what people think happens • Familiarizes everyone with the process • Identifies variations in information handling/storage
Start Desk Table cart Desk Desk Desk Desk Table Table 10 Desk Desk 11 Table 6, 7, 8, 9 6, 7, 8, 9 6, 7, 8, 9 Table Desk Desk 4a Table 6, 7, 8, 9 6, 7, 8, 9 6, 7, 8, 9 3 4b 4c Table 1 2 12 Table Table Staging Area Desk Desk Example Spaghetti Map
Batch Mode Open Mail Batch Invoices Voucher File Batch Performance Excellence Continuous Improvement Calculate Batch Total IN OUT Stack & Hold Enter Batch
One Piece Flow Open Mail File Performance Excellence Continuous Improvement Enter
Steps to ImplementingBusiness Transformation • Create a business process map to identify areas of opportunity • Identify value adding and non-value adding activities and set new performance targets • Create process flow • Reduce variation and improve quality
Process Must Be Repetitive • Customer must always receive the same level of service (or get the same answer) no matter who they ask • Customer must get the same level of service (or answers) no matter what time of the day, or day of the week they ask • Customer must always get on-time, complete service (or on-time, complete and accurate information)
Reduce Variation • Sources and causes of variation make standard business processes appear to be random, non-standard work • Missing information • Wrong work sequence • Non-standard training processes • Non-standard decision aids
Assuring First-TimeQuality Means... • Build system with appropriate information • Build poke-yoke (mistake-proofing) devices for common problems • Never passing a defect on to the next process; • Detecting abnormalities • Responding immediately • Eliminating root causes • Establishing clear decision rules
5 Why’s Tool PROBLEM 5 Why’s Example Jefferson Memorial is deteriorating WHY? Too much washing WHY? Excess bird droppings WHY? Lots of spiders to eat WHY? Lots of gnats to eat WHY? Lights are on all the time
Steps to ImplementingBusiness Transformation • Create a business process map to identify areas of opportunity • Identify value adding and non-value adding activities and set new performance targets • Create process flow • Reduce variation and improve quality • Intense focus on daily performance management and visual control