0.5
1. Fraction Viable. 0.5. rpl6b D (31.6). 0. 0. 20. 40. 60. 80. Age (generations). A. B. 1. Fraction Viable. 0.5. idh2 D (30.3). wt (25.9). wt (25.6). 0. 0. 20. 40. 60. Age (generations). C. D. 1. 1. Fraction Viable. Fraction Viable. 0.5. 0.5. tor1 D (30.6).

0.5
E N D
Presentation Transcript
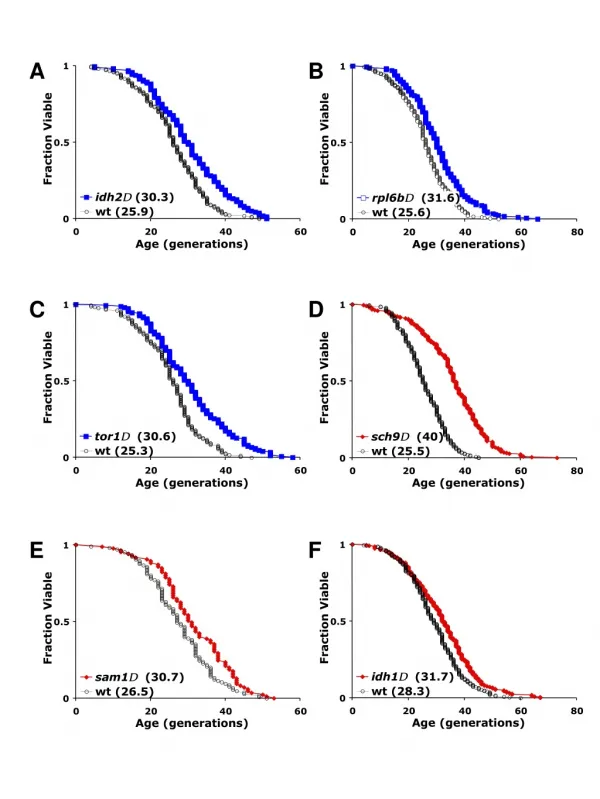
1 Fraction Viable 0.5 rpl6bD (31.6) 0 0 20 40 60 80 Age (generations) A B 1 Fraction Viable 0.5 idh2D (30.3) wt (25.9) wt (25.6) 0 0 20 40 60 Age (generations) C D 1 1 Fraction Viable Fraction Viable 0.5 0.5 tor1D (30.6) sch9D (40) wt (25.3) wt (25.5) 0 0 0 20 40 60 0 20 40 60 80 Age (generations) Age (generations) E F 1 1 Fraction Viable Fraction Viable 0.5 0.5 idh1D (31.7) sam1D (30.7) wt (28.3) wt (26.5) 0 0 0 20 40 60 80 0 20 40 60 Age (generations) Age (generations)
G H 1 1 Fraction Viable Fraction Viable 0.5 0.5 ypt6D (32.2) inp51D (31.8) wt (27.0) wt (28.5) 0 0 0 20 40 60 80 0 20 40 60 Age (generations) Age (generations) I J 1 1 Fraction Viable Fraction Viable 0.5 0.5 pkh2D (32.1) hse1D (30.5) wt (27.2) wt (25.5) 0 0 0 20 40 60 80 0 20 40 60 Age (generations) Age (generations) K L 1 1 Fraction Viable Fraction Viable 0.5 0.5 pmr1D (34.2) adh1D (33.1) wt (27.4) wt (27.8) 0 0 0 20 40 60 80 0 20 40 60 80 Age (generations) Age (generations)
M N 1 1 Fraction Viable Fraction Viable 0.5 0.5 ygr130cD (30.7) dbp3D (31.5) wt (24.5) wt (24.7) 0 0 0 20 40 60 0 20 40 60 Age (generations) Age (generations) O P 1 1 Fraction Viable Fraction Viable 0.5 0.5 alg12D (31.9) tis11D (32.4) wt (25.7) wt (25.2) 0 0 0 20 40 60 0 20 40 60 Age (generations) Age (generations) Q 1 Fraction Viable 0.5 sis2D (36.2) wt (26.5) 0 0 20 40 60 80 Age (generations)
Figure S1. Mortality curves for conserved aging genes. Replicative life span is significantly extended by deletion of IDH2 (A), RPL6B (B), TOR1 (C), SCH9 (D), SAM1 (E), IDH1 (F), INP51 (G), YPT6 (H), HSE1 (I), PKH2 (J), PMR1 (K), ADH1 (L), YGR130C (M), DBP3 (N), ALG12 (O), TIS11 (P), and SIS2 (Q). Mortality curves for the other conserved aging genes are shown in Figure 1. Curves shown in blue indicate deletion of a gene in the RBH set, while those shown in red indicate deletion of a gene in the RP set. Life span data from both mating types was combined to generate these mortality curves. Mean life spans are given in parentheses in the key of each panel.