
Uploaded by
fausto
1 SLIDES
119 VUES
10LIKES
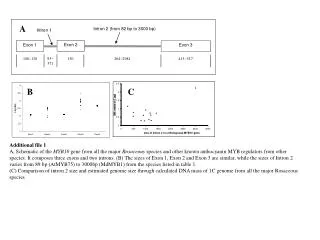
Organohalogen Levels in Tuna Samples from Japan Regions
DESCRIPTION
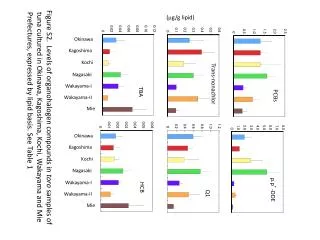
Explore PCBs, p,p’-DDE, Trans-nonachlor, HCB, TBA levels in tuna samples from Okinawa, Kagoshima, Kochi, Wakayama, Mie. Results expressed by lipid basis.
Download
1 / 1
Download Presentation

Télécharger la présentation
Organohalogen Levels in Tuna Samples from Japan Regions
An Image/Link below is provided (as is) to download presentation
Download Policy: Content on the Website is provided to you AS IS for your information and personal use and may not be sold / licensed / shared on other websites without getting consent from its author.
Content is provided to you AS IS for your information and personal use only.
Download presentation by click this link.
While downloading, if for some reason you are not able to download a presentation, the publisher may have deleted the file from their server.
During download, if you can't get a presentation, the file might be deleted by the publisher.
E N D
Presentation Transcript
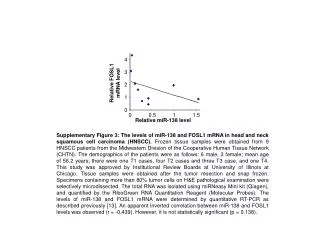
2.5 8.0 PCBs 7.0 p.p’-DDE 2.0 6.0 1.5 5.0 4.0 1.0 3.0 2.0 0.5 1.0 0 0 1.2 0.6 Trans-nonachlor 1.0 Q1 0.5 0.8 0.4 0.6 0.3 0.4 0.2 (g/g lipid) 0.2 0.1 0 0 0.12 0.06 0.10 HCB TBA 0.05 0.08 0.04 0.06 0.03 0.04 0.02 0.02 0.01 0 0 Mie Mie Kochi Kochi Okinawa Okinawa Nagasaki Nagasaki Kagoshima Kagoshima Wakayama-I Wakayama-I Wakayama-II Wakayama-II Figure S2. Levels of organohalogen compounds in toro samples of tuna cultured in Okinawa, Kagoshima, Kochi, Wakayama and Mie Prefectures, expressed by lipid basis. See Table 1

More Related
Audio
Live Player