Kinetics of ATF3 Expression in Response to Angiotensin II in Mouse Atria and Ventricles
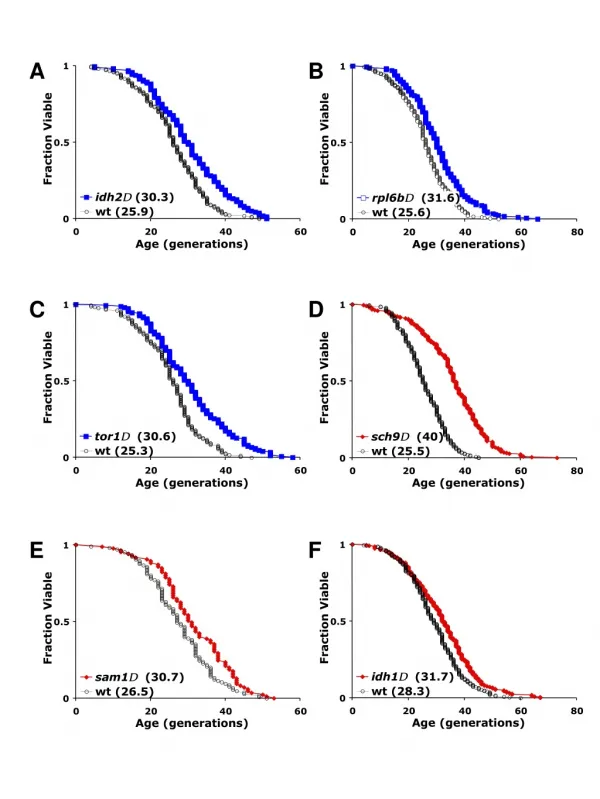
This study investigates the expression dynamics of ATF3 in mouse atria and ventricles after Angiotensin II (Ang II) administration. Western blot analyses reveal differential ATF3 expression levels following a 1.5 mg/kg Ang II injection over time, compared with saline controls. Densitometric analysis normalizes ATF3 levels against α-tubulin. Additional experiments in rats confirm that Ang II induction of ATF3 is confined to the left heart chambers, providing insights into the chamber-specific responses of cardiac tissues to Ang II.

Kinetics of ATF3 Expression in Response to Angiotensin II in Mouse Atria and Ventricles
E N D
Presentation Transcript
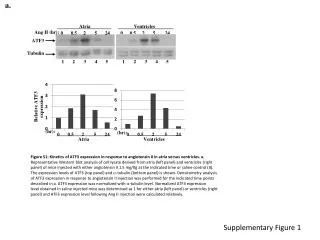
a. Atria Ventricles Ang II (hr): 0.5 2 5 24 0 0.5 2 5 24 0 ATF3 Tubulin 1 2 3 4 5 1 2 3 4 5 (hr): (hr): Atria Ventricles Figure S1: Kinetics of ATF3 expression in response to angiotensin II in atria versus ventricles. a. Representative Western blot analysis of cell lysate derived from atria (left panel) and ventricles (right panel) of mice injected with either angiotensin II 1.5 mg/Kg at the indicated time or saline control (0). The expression levels of ATF3 (top panel) and -tubulin (bottom panel) is shown. Densitometry analysis of ATF3 expression in response to angiotensin II injection was performed for the indicated time points described in a. ATF3 expression was normalized with -tubulin level. Normalized ATF3 expression level obtained in saline injected mice was determined as 1 for either atria (left panel) or ventricles (right panel) and ATF3 expression level following Ang II injection were calculated relatively. Supplementary Figure 1
a. Figure S2 Angiotensin II induction of ATF3 expression is confined to the left chambers in rats. a.Representative Western blot analysis (upper panel) of three independent experiments of cell lysatederived from: left atrium (LA), right atrium (RA), left ventricle (LV) and right ventricle (RV). Lysatewas prepared from one rat injected with either saline-control (-, lane 1) or angiotensin II (Ang II,+, lane 2, 0.5 mg/Kg). The expression levels of ATF3 (top panel) and GAPDH loading control (bottom panel) are shown. b. Representative Western blot analysis (upper panel) of cell lysate derived from the left atrium of saline injected rat or rat injected with either vehicle control or AT2R antagonist (PD123319; 15 mg/kg) 30 minutes prior to injection with angiotensin II (lanes 2 and 3, Ang II +, 0.15 mg/Kg). Rats were sacrificed three hours following angiotensin II injection. The expression levels of ATF3 (top panel) and GAPDH loading control (bottom panel) are shown. Densitometry analysis (lower panel) of ATF3 expression of three independent experiments as described in b (upper panel). ATF3 expression was normalized with GAPDH expression level. Normalized ATF3 expression level of saline injected rats (lane 1) was determined as 1 and ATF3 expression level of either Ang II injected rats or PD123319 pretreated followed by Ang II injection rats were calculated relatively. The results represent the mean and SEM of three independent experiments. Asterisk (*) indicates P value < 0.05. Ang II: Left atrium - + + Ang II: - - + PD123319: GAPDH ATF3 RV LV RA LA - - + - + - + + GAPDH b. 1 2 3 ATF3 1 2 1 2 1 2 1 2 * P<0.05 * P<0.05 + - + Ang II: + - PD123319: - Supplementary Figure 2 a-b