0.1
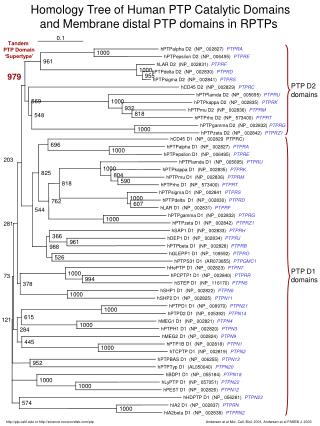
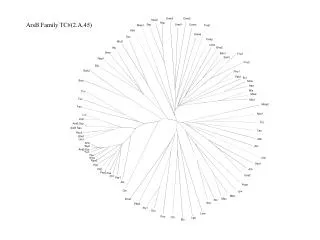
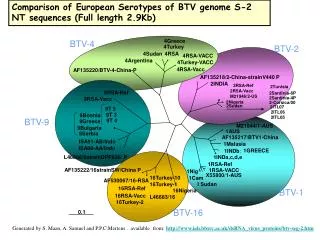
Arabidopsis Aquaporins. Slide 1. AtTIPC. AtTIP2C. TIP. AtTIPK. AtTIPH. AtTIPD. AtTIPI. AtTIP2G. AtTIPG. Clustal-X/TreeView. AtMIPH. AtMIPK. AtTIPA. AtTMP2c. AtTIPB. AtMIPL. AtPIP2a. PIP. GLPGF E. coli. AtMIPG. AtPIP3. AtMIPI. AtNLM6. AtPIP1a. AtPIP1b. AtMIPF. AtTMPB.

0.1
E N D
Presentation Transcript
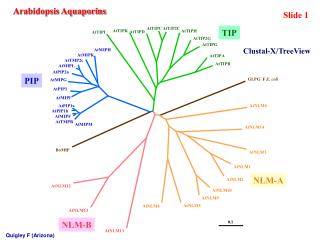
Arabidopsis Aquaporins Slide 1 AtTIPC AtTIP2C TIP AtTIPK AtTIPH AtTIPD AtTIPI AtTIP2G AtTIPG Clustal-X/TreeView AtMIPH AtMIPK AtTIPA AtTMP2c AtTIPB AtMIPL AtPIP2a PIP GLPGF E. coli AtMIPG AtPIP3 AtMIPI AtNLM6 AtPIP1a AtPIP1b AtMIPF AtTMPB AtMIPM AtNLM14 BoMIP AtNLM3 AtNLM1 NLM-A AtNLM2 AtNLM12 AtNLM10 AtNLM9 AtNLM5 AtNLM4 AtNLM13 NLM-B 0.1 AtNLM11 Quigley F (Arizona)
Quigley F (Arizona) Slide 2 Location of AQP Genes on Chromosomes 10 20 30 5 Mb TMPB TIPB NLM14 TIPL TIPA NLM4 Ch-I (15) MIPI NLM8 TIPK NLM7 NLM3 MipH PIP1b Ch-II (4) rDNA TIPg MIPL TMP2c NLM13 NLM6 TIPD TIP2G TIPI PIP2a NLM11 Ch-III (14) MIPK PIP1a MIPF TIPH NLM5 TIPC NLM1 NLM2 MIPM PIP3 Ch-IV (3) NLM12 NLM9 NLM10 TIP2c MIPG Ch-V (12) - duplicated chromosome portions with AQPs. * - NLM7 and TipL encode for 3 transmembrane domains. Loci identified by the same color scheme encode closely related genes. - position of centromers (Mb from end).
Slide 3 Exon-Intron Structure of Arabidopsis AQP Genes NLM-B ++ # NLM-A LB LE TIP H1 H2 H3 H4 H5 H6 * + ** + PIP NPA NPA Arrows show the position of introns within aquaporin sub-classes H1-6 are transmembrane segments. LB, LE: Loops B and E with conserved N-P-A motif. *Intron absent from TIPc, TIP2c, TIPg, TIP2g and TIPh. **Intron absent from TIPh. +Intron sliding in MIPg (appears where intron 2 in TIPs is found). #Intron absent from NLM14. ++Intron absent from NLM3 & NLM5. Quigley F (Arizona)
Slide 4 Structure of the putative Pseudogene TIPL* NLM-B ++ # NLM-A TIP * ** PIP H1 H2 H3 H4 H5 H6 NPA NPA TIPL H4 H5 H6 STOP TIP sub-family ATG H3 missing, truncated AQP with 2 TM, no EST reported. *We had considered NLM14 a Pseudogene before, but closer inspection indicates that is an authentic gene. Quigley F (Arizona)
Slide 5 Structure of the putative Pseudogene NLM7* ++ # H1 H2 H3 H4 H5 H6 * ** NLM-B NPA NPA ATG NLM-A Attila Tn-like sequence fragment H4 H5 H6 H3 NLM7 TIP frame shift, homology continues PIP NLM-A sub-family Protein start after H3; frame-shift (sequence error?) Would lead to short peptide, but sequence homology Continues (5’ and 3’ including the C-terminus; no ESTs reported *We had considered NLM14 a Pseudogene before, but closer inspection indicates that is an authentic gene. Quigley F (Arizona)
Slide 6 Structure of the putative Pseudogene NLM8* ++ # H1 H2 H3 H4 H5 H6 * ** NLM-B NPA NPA STOP NLM-A H1 H2 H3 H5 H6 NLM8 Different reading frame ATG Predicted longer N-terminal sequence; TM H3,4, and 5 are missing; Homology exists but a different reading frame is used Protein with longer C-terminal end. No ESTs reported. TIP PIP NLM-A sub-family *We had considered NLM14 a Pseudogene before, but closer inspection indicates that is an authentic gene. (Computer prediction missed Exon 1 - but close inspection indicates its presence - no ESTs reported. Quigley F (Arizona)
Slide 7 AtTIP2g is close to a Mutator-like Element ORF mudrA ORF AtTIP2g at3g26530 ORF 9 bp target site duplication TTAAAAAAA Chromosome 3 BAC, MFE16; MULE-23 (Mutator-like element, group 23*, 12,268 bp) 1Kb The region 5’ of the ATG to the insertion site of MULE-23 is 178 bp in length. * Zhihui Yu, Stephen I. Wright and Thomas E.Bureau, Genetics 156: 2019-2031 (2000) Quigley F (Arizona)
Slide 8 Mesembryanthemum AQPs are found in different Locations membrane localization MIP-A 41kD TO PM Even in the unstressed state some PIPs are found in more than one membrane. Analysis by continuous sucrose gradient fractionation confirmed this fact (using antibodies to markers of PM, To, mitochondria, chloroplasts, nuclei and the endoplasmic reticulum Under stress conditions (drought, salinity, ABA) the redistribution is additionally affected. Barkla et al., 1999 Kirch et al., 2000 Vera-Estrella et al., 2001 and unpublished data. * * MIP-B 32 kD # MIP-C 26 kD To - tonoplast; PM - plasma membrane. Antibodies raised against peptides. MIP-A, B, C align with PIPs. MIP-F aligns with TIPs. MIP-F 33 kD *dimer forms (~41 kD) #degradation product Barkla, B, Vera-Estrella, R. & Pantoja, O. (UNAM, Mexico)
Slide 9 Expression of GFP under control of the Ice plant promoter MipB in Arabidopsis. For components of the vector see Grebenok et al., 1997. The promoter is not active in the primary root meristem But in the elongation zone. MipB is active, as in the ice plant, in lateral root meristems in Arabidopsis. Shuhua Yuan, MS thesis, (Arizona) 2001
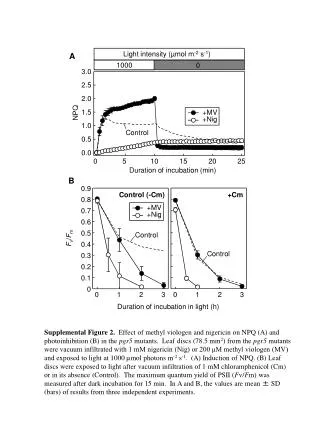
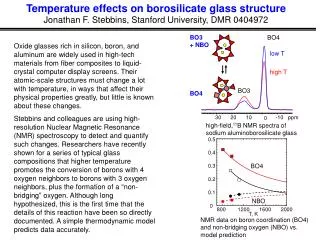
Slide 10 We have been using the stopped flow photometer to determine the osmotic permeability of the tonoplast from the halophyte Mesembryanthemum crystallinum, as well as changes induced by salt and drought stress. The figure below shows original recordings of the changes in light scattering resulting from the imposition of a 100 mOsmol osmotic gradient (hyperosmotic) or under iso-osmotic conditions (iso-osmotic) in tonoplast vesicles from M. crystallinum leaves. The rate constant (kos) was obtained by fitting a single exponential to the curve, from where we have determined a Pos Analysis of tonoplast vesicles using stopped-flow photometric determination of light-scattering. of 1205 µm s -1, a value twice that of tobacco cell cultures (Maurel et al., 1997) and 14-times higher than that for wheat roots (Niemietz and Tyerman, 1997). From similar experiments carried out at different temperatures, we have calculated a value for the activation energy for water movement across the tonoplast vesicles of M. crystallinum of 8.97 kJ/mol -1 K -1, a smaller value than that reported for the tonoplast of wheat Roots (23.32 kJ mol -1 K -1) and tobacco cell cultures (10.47 kJ mol-1 K -1). Vera-Estrella, R. & Pantoja, O. (UNAM, Mexico)
1 Na+ 1 Na+; 0.3 K+ 0.3 K+ 50 nA 2.5 min 1 Na+ 1 Na+; 0.3 K+ 0.3 K+ 50 nA 5 min Slide 11 Conductance of a Na+/K+-Transporter in Xenopus Oocytes water injected oocyte cRNA injected oocyte Carlos Muñoz-Garay and Omar Pantoja (IBT, UNAM, Cuernavaca, Mexico)
Slide 12 The flux of deuterated water into and out of corn roots, +/- 150 mM NaCl, was measured by NMR. _____ The analysis, using models for N-layers (N-= 1, 2, etc.), indicated a major influence of the endodermis and trans-cellular flux of water through all cells of the cortex as the most likely route for water movement. ______ In stress tissues water flux is reduced most likely by reduced amounts of AQPs See: Rosenberg et al. (2000) ASPP Annual Meeting, abstract #454 Rosenberg, J & Shachar-Hill, Y (New Mexico State)
Slide 13 Rice AQPs - Salt Shock Water Channel ESTs - Time Course in Rice OC104E01 - WCP-I Decline & recovery of transcripts during NaCl stress - Water channels (1 PIP; 3 TIP) OC03G03 - WCP-II OC104A02 - WCP-IV OC03F03 - WCP-III 3.0 Complete recovery after 7d (+) 2.0 +1.6-fold 1.0 0.0 PIP-AQP 15 minutes -1.6-fold -1.0 1 hour after NaCl shock 3 hours -2.0 6 hours 24 hours 1 week -3.0 10.5 11.5 12.5 13.5 14.5 15.5 Arrays can report strength & relative strength of expression/abundance Log(2) Signal Intensity Decline after 15 min ( ) Kawasaki et al (U. Arizona, 2001)