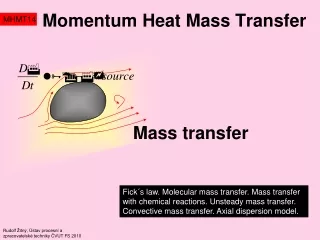
Mass Transfer
Mass Transfer. Section # 8. Sheet#2 , Problem#3. Givens: Tray dryer of 4 sections in series (A, B, C, and D) T 1,3,5,7 =325 K, w 1 =0.005, %RH 2,4,6,8 = 60%, V 8 = 4.75 m 3 /sec The wet material in each dryer reaches t w Neglect heat losses Required:

Mass Transfer
E N D
Presentation Transcript
Mass Transfer Section # 8
Sheet#2 , Problem#3 Givens: Tray dryer of 4 sections in series (A, B, C, and D) T1,3,5,7=325K, w1=0.005, %RH2,4,6,8 = 60%, V8= 4.75 m3/sec The wet material in each dryer reaches tw Neglect heat losses Required: a) The temperature of the wet material at the end of each section b) Rate of water removal c) Required air inlet temperature if the drying is to be carried out in a single stage.
Sheet#2 , Problem#3 1 2 3 4 5 8 7 6 Note: Neglecting heat losses mean that we will use the adiabatic saturation lines. Heater Heater A B Heater D C
Sheet#2 , Problem#3 Solution Steps: 1) locate point 1 by knowing 2 information about it. 2) Move on the corresponding adiabatic line till you meet 60%RH. This is point 2 3) If you continue moving on the adiabatic line till you reach 100%RH, you will get tw of the air in stage A (which is the temperature of the wet material at the end of stage A). 4) From point 2, move horizontally till you reach (325oK). This is point 3 5) Move on the corresponding adiabatic line till you meet 60%RH. This is point 4. And so on till you get T8
Sheet#2 , Problem#3 Directly from the chart: TA = 23.5oC, TB= 28.5oC, TC= 32oC, TD=34oC To calculate rate of water removal: • Rate of water removal = (w8-w1)* md • From the chart: w8= 0.031 • md = V8/ Vw8 Vw8 = 22.4 (t8+ 273) [ 1 + w8 ]= 0.938 m3 / kg dry air P * 273 Mg Mv • md = V8/ Vw8 = 4.75 / 0.938 = 5.06 kg dry air / sec • Rate of water removal = (w8-w1)* md = 0.13156 kg water / sec
Sheet#2 , Problem#3 • To get the required air inlet temperature if the drying is to be carried out in a single stage: • Carrying the same drying load in a single stage means that rate of water removal is the same (i.e: w1, w8, and the dry air flow rate is the same) • This means that point 8 on the chart will be the same. The point describing the inlet air conditions will be located at w=0.005. • As drying takes place adiabatically, we will move on the adiabatic line corresponding to point 8 till we reach w=0.005. The point got is the inlet air. • On reaching the dry temperature of the inlet air, we will find it 105oC.
Design Equation for Cooling towers and dehumidifiers Water in Gas out Z = HTG * NTG(L2) (V2) Where: • Z : Height of the packing Z • HTG: Height of a gas enthalpy transfer unit = V’ / S ky a • NTG: Number of gas enthalpy transfer units Hv2 Water out Gas in = ∫ d Hv (L1) (V1) Hv1 Hi - Hv
Design Equation for Cooling towers and dehumidifiers • V’: mass flow rate of dry gas (without its associated vapor) • S: Tower cross section area • Hv1: Enthalpy of the entering gas (dry gas + associated vapor) • Hv2: Enthalpy of the exiting gas (dry gas + associated vapor) • Hi : Enthalpy at the liquid- gas interface (enthalpy at equilibrium)
Operating Line Equation for Cooling towers and dehumidifiers • Hv2 -Hv1 = L avg CL TL2 –TL1 V’ Where: TL2 : Temperature of the water entering the tower TL1 : Temperature of the water exiting the tower L avg: Average liquid flow rate = ( L1 + L2 ) 2 CL : Specific heat of the liquid
Equilibrium Curve for Cooling towers and dehumidifiers • The equilibrium curve is the “interface conditions locus”. It is also called the saturation curve How to draw the equilibrium Curve? 1) Determine the range of temperatures of your system ( Mainly TL2 and TL1 ) 2) Choose 5 or 6 temperature values within the range 3) From the chart, get Hs corresponding to the chosen temperature values 4) Prepare a table between T and Hs, then draw the curve . The drawn curve is the equilibrium curve
Tie-Line Equation for Cooling towers and dehumidifiers • Hv – Hi = - hL a TL – T I kya Where: hL : Heat transfer coefficient in the liquid phase • The tie-line equation is the equation showing the relationship between Hv and Hi • This equation is very important so as to be able to calculate NTG
Tie-Line Equation for Cooling towers and dehumidifiers • If hL is very very high, then the slope of the tie-line will be almost vertical. • In this case: a) TL =Ti b) Hi = H* c) ky=koy d) Hv – H* = - hL a TL – T i koya e) Z = HTOG * NTOG Where: Hv2 NTOG = ∫ d Hv Hv1 H* - Hv
Sheet#2 , Problem#4 Givens: Water cooling tower, forced draft, counter-current TL2=45oC , TL1=25oC T1=32oC, Tw1=15oC hLa/ ky a = 600 (joule/ mole oC) ky a = 0.2 V’/S Liquid Rate = 900 (mole/ hr m2) Required: a) The minimum gas rate. b) The tower height if a gas flow rate is twice the minimum gas rate.
Sheet#2 , Problem#4 Solution • To get the minimum gas rate, we want to get a pinch point. • To get a pinch point, we must have: a) The equilibrium curve b) a point c) a locus • As TL2=45oC, and TL1=25oC, then the temperature range that we will take to draw the equilibrium curve will be (50, 20 oC) • Steps: a) Draw the equilibrium curve on a graph paper b) From Tw1 andT1, get Hv1 from the chart c) As we have TL1 , and Hv1, then we can locate point (1) on the operating line d) Draw a locus for TL2 e) Match point (1) with the (intersection between the equilibrium curve and the locus of TL2 ) to get the pinch point.
Sheet#2 , Problem#4 • The equilibrium curve table: • As T1=32oC, Tw1=15oC get Hv1 = 40 kj/kg dry air Locate point 1
Sheet#2 , Problem#4 • When you match point (1) with the (intersection between the equilibrium curve and the locus of TL2 ), you will cut the equilibrium curve at about (40oC). So, this is the pinch point. • H’v2 -Hv1 = (L avg CL ) / S 160-40= 900*4.18*18 T’L2 –TL1 V’min / S 40 –25 G’min = 8.46 kg / hr m2
Sheet#2 , Problem#4 • If the gas flow rate is twice the minimum gas rate, the operating line slope will be different than that corresponding to the pinch point. Only the denominator will change, while the numerator is constant (L avg CL / S). • we will carry the following steps to get point (2): a) From Point (1), and using the ruler, measure 2 G’min . The point got is point (x). b) From the pinch point, draw a horizontal locus and extend the line c) From point (x), draw a vertical locus and extend till you meet the line draw in step (b). The point got is point (y). d) Match y with point (1). You will cut the locus of TL2 in a point. This point is point (2). • Get Hv2 = 120 kj / kg dry air
Sheet#2 , Problem#4 • The tower height is required if the gas flow rate is twice the minimum. • Z = HTG * NTG • HTG= V’ / S ky a = 1 / 0.2 = 5 m (WHY?) Hv2 • NTG = ∫ d Hv We need the tie-line equation Hv1 Hi – Hv • Hv – Hi = - hL a = - 600 (joule/ mole oC) = -20.618 kj / kg oC TL – T I kya • we will carry the following steps to plot the tie-lines: - For Point (1): a) Hv1 – H’i1 = -20.618 40 - H’i1 = -20.618 TL1 – T’i1 25 – T’i1 b) Sub. by any value for T’i1 (24 for example), and sub. in the above equation to get H’i1. Now you can locate a point. You can name this point (x) c) Match (1) with (x) to cut the eqm. curve in a point. The line you are drawing now is a tie-line
Sheet#2 , Problem#4 • The you can draw the rest of tie-lines parallel to the drawn one. • To calculate the value of NTG, we need to calculate the value of integration. The value of integration can be calculated using Simpson’s rule. Thus, we need to sub. by Hv values with constant intervals. • The following table can be constructed: • NTG = (20/2) * (0.036 + 0.016666 + 2 (0.036 + 0.03125 + 0.0232)) = 2.33 • Get Z = HTG * NTG = 5 * 2.33 = 11.678 m
Sheet#2 , Problem#5 Givens: Water cooling tower, induced draft, counter-current L2 = 15 kg/sec , TL2=45oC , TL1=29oC T1=30oC, Tw1=24oC V’= 1.5 V’min For liquid rate of at least 2.7 kg / m2 sec ky a = 0.9 kg/ m3 sec For gas rate of at least 2 kg / m2 sec Make up water: 500 ppm hardness Circulating water : 2000 ppm hardness Windage losses = 0.2 % of the circulation rate. Required: a) The dimensions of the packed section. b) The amount of make up water
Sheet#2 , Problem#5 Solution • To get the minimum gas rate, we want to get a pinch point. • To get a pinch point, we must have: a) The equilibrium curve b) a point c) a locus • As TL2=45oC, and TL1=29oC, then the temperature range that we will take to draw the equilibrium curve will be (50, 25 oC) • Steps: a) Draw the equilibrium curve on a graph paper b) From Tw1 andT1, get Hv1 from the chart c) As we have TL1 , and Hv1 , then we can locate point (1) on the operating line d) Draw a locus for TL2 e) Match point (1) with the (intersection between the equilibrium curve and the locus of TL2 ) to get the pinch point.
Sheet#2 , Problem#5 • The equilibrium curve table: • As T1=30oC, Tw1=24oC get Hv1 = 72 kj/kg dry air Locate point 1 • Then, perform the same steps shown in the previous problem to get point (2)
Sheet#2 , Problem#5 • Hv2 -Hv1 = (L avg CL ) 164-72= 15*4.18 V’ = 10.904 kg/sec TL2 –TL1 V’ 45 –29 V’ • Z = HTG * NTG • HTG= V’ / S ky a For liquid rate of at least 2.7 kg / m2 sec • But, ky a = 0.9 kg/ m3 sec For gas rate of at least 2 kg / m2 sec • Take min. liquid rate = 2.7 kg/ m2 sec = Lavg / S S = 5.555555 m2 S isn’t suitable G’ < G’ min G’ = V’ / S = 1.96 kg/ m2 sec Take min. gas rate = 2 kg/ m2 sec = V’ / S S = 5.452 m2 Liquid rate > min liquid rate Liquid rate= Lavg / S = 2.75 kg/ m2 sec S is suitable, and we can use ky a = 0.9 kg/ m3 sec
Sheet#2 , Problem#5 • HTG= V’ / S ky a = 10.904 / (5.452 *0.9) = 2.2222 m Hv2 • NTG = ∫ d Hv We need the tie-line equation Hv1 Hi – Hv • As nothing is stated about hLa, we will operate on the overall coefficients (The vertical driving force). • The following table can be constructed: • NTG = (20/2) * (0.0476 + 0.0256 + 2 (0.05 + 0.04 + 0.0357)) + (1/2) * (0.0256 + 0.0227) * (164-152) = 3.5358 • Get Z = HTG * NTG = 2.22222 * 3.5358 = 7.86 m • S = (π / 4) * Diameter2 Diameter = 2.634 m
Sheet#2 , Problem#5 • To get the amount of make-up water, we will perform water material balance on the cooling tower: Make-up = Evaporation losses + Windage losses + Blow down losses (1) • Windage losses = (0.2 / 100) * Lavg = (0.2/100)*15 = 0.03 kg/sec (2) • To get the blow down losses, we need a salt material balance: M xm = E xE + W xW + B xB (3) • xm = 500 ppm , xE = zero , xW = 2000 ppm, xB=2000 ppm (4) • If we get the amount of (evaporation losses), we can use it together with (1), (2), (3), and (4) to get the amount of make-up water. • Evaporation losses = (w2-w1) * V’ (5) Where: - w1 can be easily got from the chart as we have 2 information about the entering air - we can’t get w2 directly as we don’t know anything about the exiting air except the humid enthalpy. (Mickley method) can be used to get the temperature of the exiting air. Thus, we can get w2
Sheet#2 , Problem#5 • How to perform Mickley’s method? a) Point (1) on the operating curve represents (TL1, Hv1). The point representing the entering gas has the same enthalpy (Hv1), but different temperature (Tv1). So, by knowing Tv1, you can locate the point representing the entering gas. You can name it (a) b) Move horizontally from point (a) till you cut the operating line in (a’) c) Move from (a’) to the eqm. curve using the tie-lines’ slope. The point got is (a’’). In this problem, you will move vertically from a’ to the eqm. curve as we are using the overall coefficients d) Match (a’’) with (a). From (a), measure small distance on the line (a-a’’). The point got is (b) e) Move horizontally from point (b) till you cut the operating line in (b’) f) Move from (b’) to the eqm. curve using the tie-lines’ slope. The point got is (b’’). g) Match (b’’) with (b). From (b), measure small distance on the line (b-b’’). The point got is (c) h) Repeat the steps till you reach the locus of Hv2. The temperature corresponding to this point is (Tv2).
Sheet#2 , Problem#5 • From the previous graph, get Tv2 = 40oC • From the chart: at Tv2 = 40oC, Hv2= 164 kj / kg dry air w2 = 0.05 • Sub. in eqn (5) get E = (0.05 – 0.0175) * 10.904 = 0.35438 kg/sec • Solving the 5 equations previously discussed together yields: B = 0.088 kg/sec, and M = 0.4725 kg/sec
Sheet#2 , Problem#6 Givens: Water cooling tower, induced draft, counter-current L2 = 15 kg/sec , TL2=45oC T1=32oC, Tw1=28oC V’= 10.904 kg/sec HTG = 2.2222222 m NTG: 3.5358 Required: The temperature of the exiting water
Sheet#2 , Problem#6 • The givens were written like that, as we are operating on the same tower of the previous problem and with the same flow rates. Thus, Z and HTG are the same. Consequently, NTG will be also the same. • In this case, Hv1 will change as the air conditions has changed. Hv1 = 92 kj / kg dry air • The operating line equation is now: Hv2 -Hv1 = (L avg CL ) Hv2-92= 15*4.18 = 5.75 (1) TL2 –TL1 V’ 45 –TL1 10.904 Hv2 • NTG = ∫ d Hv = 3.5358 (2) 92 Hi – Hv • Based on the above equations, we need trial and error to calculate TL1 • 1st assumption: TL1 = 31oC - From (1), get Hv2 = 172.5 kj/kg dry air - Now, we can draw the operating line as we have (point 1), and the slope - Now, we want to calculate NTG and check that it is 3.5358.
Sheet#2 , Problem#6 • The following table can be constructed: • NTG = (10/2) * (0.077 + 0.025 + 2 (0.077 + 0.071 + 0.056 +0.056 +0.05 +0.038+0.029)) = 4.28 we need other assumption • 2nd assumption: TL1 = 32oC - From (1), get Hv2 = 166.75 kj/kg dry air NTG = (15/2) * (0.052 + 0.0225 + 2 (0.052 + 0.0476 + 0.04166 +0.0294)) = 3.12 we need other assumption • We can use interpolation to get the right TL1: TL1 - 31 = 3.5358 - 4.28 TL1 = 31.64oC 32 - 31 3.12 - 4.28
Sheet#2 , Problem#6 • 1st trial
Sheet#2 , Problem#6 • 2nd trial