Synthesis
STAT 101 Dr. Kari Lock Morgan 12/6/12. Synthesis. Big Picture Essential Synthesis Bayesian Inference (continued) Review Synthesis Activities. Data Collection. The way the data are/were collected determines the scope of inference

Synthesis
E N D
Presentation Transcript
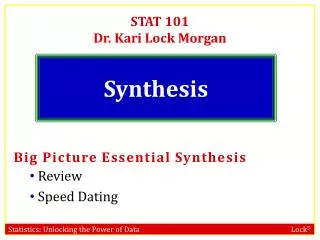
STAT 101 Dr. Kari Lock Morgan 12/6/12 Synthesis • Big Picture Essential Synthesis • Bayesian Inference (continued) • Review • Synthesis Activities
Data Collection • The way the data are/were collected determines the scope of inference • For generalizing to the population: was it a random sample? Was there sampling bias? • For assessing causality: was it a randomized experiment? • Collecting good data is crucial to making good inferences based on the data
Exploratory Data Analysis • Before doing inference, always explore your data with descriptive statistics • Always visualize your data! Visualize your variables and relationships between variables • Calculate summary statistics for variables and relationships between variables – these will be key for later inference • The type of visualization and summary statistics depends on whether the variable(s) are categorical or quantitative
Estimation • For good estimation, provide not just a point estimate, but an interval estimatewhich takes into account the uncertainty of the statistic • Confidence intervals are designed to capture the true parameter for a specified proportion of all samples • A P% confidence interval can be created by • bootstrapping (sampling with replacement from the sample) and using the middle P% of bootstrap statistics
Hypothesis Testing • A p-value is the probability of getting a statistic as extreme as observed, if H0 is true • The p-value measures the strength of the evidence the data provide against H0 • “If the p-value is low, the H0 must go” • If the p-value is not low, then you can not reject H0 and have an inconclusive test
p-value • A p-value can be calculated by • A randomization test: simulate statistics assuming H0 is true, and see what proportion of simulated statistics are as extreme as that observed • Calculating a test statistic and comparing that to a theoretical reference distribution (normal, t, 2, F)
Regression • Regressionis a way to predict one response variable with multiple explanatory variables • Regression fits the coefficients of the model • The model can be used to • Analyze relationships between the explanatory variables and the response • Predict Y based on the explanatory variables • Adjust for confounding variables
Romance • What variables help to predict romantic interest? • Do these variables differ for males and females? • All we need to figure this out is DATA! • (For all of you, being almost done with STAT 101, this is the case for many interesting questions!)
Speed Dating • We will use data from speed dating conducted at Columbia University, 2002-2004 • 276 males and 276 females from Columbia’s various graduate and professional schools • Each person met with 10-20 people of the opposite sex for 4 minutes each • After each encounter each person said either “yes” (they would like to be put in touch with that partner) or “no”
Speed Dating Data What are the cases? • Students participating in speed dating • Speed dates • Ratings of each student
Speed Dating What is the population? • Ideal population? • More realistic population?
Speed Dating It is randomly determined who the students will be paired with for the speed dates. We find that people are significantly more likely to say “yes” to people they think are more intelligent. Can we infer causality between perceived intelligence and wanting a second date? • Yes • No
Successful Speed Date? What is the probability that a speed date is successful (results in both people wanting a second date)? To best answer this question, we should use • Descriptive statistics • Confidence Interval • Hypothesis Test • Regression • Bayes Rule
Successful Speed Date? 63 of the 276 speed dates were deemed successful (both male and female said yes). A 95% confidence interval for the true proportion of successful speed dates is • (0.2, 0.3) • (0.18, 0.28) • (0.21, 0.25) • (0.13, 0.33) = 63/276 = 0.23 0.23 0.23 0.05 (0.18, 0.28)
Pickiness and Gender Are males or females more picky when it comes to saying yes? Guesses? • Males • Females
Pickiness and Gender Are males or females more picky when it comes to saying yes? How could you answer this? • Test for a single proportion • Test for a difference in proportions • Chi-square test for association • ANOVA • Either (b) or (c)
Pickiness and Gender Do males and females differ in their pickiness? Using α = 0.05, how would you answer this? a) Yes b) No c) Not enough information
Reciprocity Are people more likely to say yes to someone who says yes back? How would you best answer this? • Descriptive statistics • Confidence Interval • Hypothesis Test • Regression • Bayes Rule
Reciprocity Are people more likely to say yes to someone who says yes back? How could you answer this? • Test for a single proportion • Test for a difference in proportions • Chi-square test for association • ANOVA • Either (b) or (c) p-value =0.3731
Reciprocity • Are people more likely to say yes to someone who says yes back? • p-value = 0.3731 • Based on this data, we cannot determine whether people are more likely to say yes to someone who says yes back.
Race and Response: Females Does the chance of females saying yes to males differ by race? How could you answer this question? • Test for a single proportion • Test for a difference in proportions • Chi-square goodness of fit • Chi-square test for association • ANOVA p-value =0.69
Race and Response: Males Each person rated their date on a scale of 1-10 based on how much they liked them overall. Does how much males like females differ by race? How would you test this? • Chi-square test • t-test for a difference in means • Matched pairs test • ANOVA • Either (b) or (d) p-value =0.892
Physical Attractiveness Each person also rated their date from 1-10 on the physical attractiveness. Do males rate females higher, or do females rate males higher? Which tool would you use to answer this question? • Two-sample difference in means • Matched pair difference in means • Chi-Square • ANOVA • Correlation
Physical Attractiveness 95% CI: (0.10, 0.71) p-value
Other Ratings • Each person also rated their date from 1-10 on the following attributes: • Attractiveness • Sincerity • Intelligence • How fun the person seems • Ambition • Shared interests • Which of these best predict how much someone will like their date?
Multiple Regression MALES RATING FEMALES: FEMALES RATING MALES:
Ambition and Liking How does the perceived ambition of a date relate to how much the date is liked? How would you answer this question? • Inference for difference in means • ANOVA • Inference for correlation • Inference for simple linear regression • Either (b), (c) or (d)
Ambition and Liking r = 0.44, SE = 0.05 Find a 95% CI for . 0.28, SE = 0.06 Test whether 1 differs from 0. t = 0.28/0.06 = 4.67 => significant .44 2(.05) = (0.34, 0.54)
Data! • If you have a question that needs answering… • ALL YOU NEED IS DATA!!!!
Final • Tuesday, December 11th, 2 – 5pm • No make-ups, no excuses • 25% of your course grade • Cumulative from the entire course • Open only to a calculator and 3 double-sided pages of notes prepared only by you • StatKey will be available if needed for theoretical distributions, but a calculator will be sufficient
Office Hours Before Final • Sunday, 4 – 7pm, Tracy, Old Chem 211 A • Monday, 12 – 3pm, Prof Morgan, Old Chem 216 • Monday, 4 – 6pm, Heather, Old Chem 211A • Monday, 6 – 9pm, Sam, Old Chem 211A • Tuesday, 12 – 1pm, Prof Morgan, Old Chem 216
To Do • Project 2 individual grades on Sakai (due Monday, 12/10) • Do Homework 9 (all practice problems) • Study for final! • Do Big Picture Essential Synthesis problems (solutions) • Do Practice Final (solutions) • If you want more problems to do… • any odd essential synthesis or review problems (solutions under documents on course website) • any problem in the book (solutions in my office – can check during office hours on Monday)