Download
1 / 4
40 likes | 58 Vues
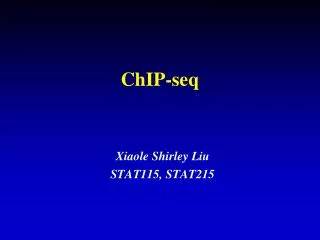
This study examines the binding of p53, H3, and Ptbp2 in IgA+ CH12 cells using ChIP analysis. The experiments reveal insights into the regulation of gene expression and mutation patterns in these cells.

E N D
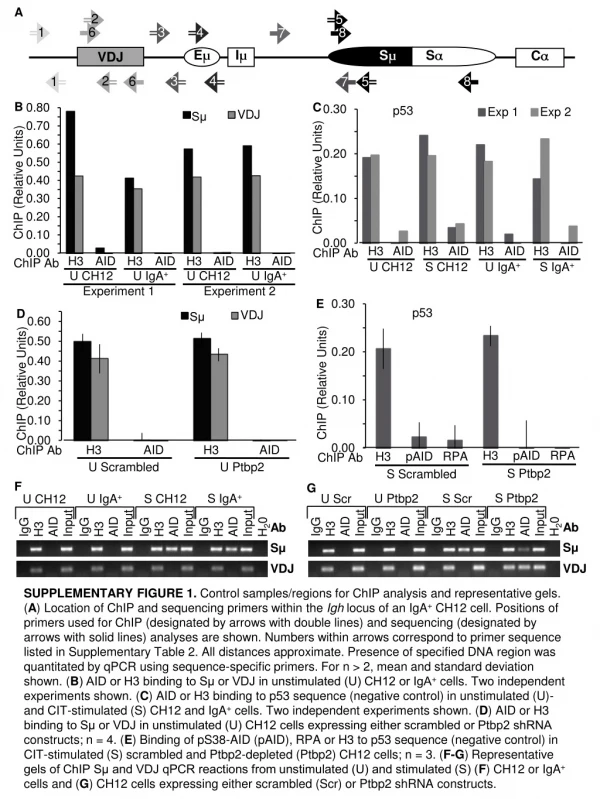
A C B Sμ ChIP (Relative Units) ChIP (Relative Units) p53 H3 AID H3 AID H3 AID H3 AID ChIP Ab D Sμ U CH12 U IgA+ U CH12 U IgA+ Experiment 1 Experiment 2 ChIP (Relative Units) F G S Ptbp2 S IgA+ U Ptbp2 S Scr U IgA+ S CH12 U Scr U CH12 IgG H3 AID Input IgG H3 AID Input IgG H3 AID Input H20 IgG H3 AID Input IgG H3 AID Input IgG H3 AID Input IgG H3 AID Input H20 IgG H3 AID Input Ab Ab H3 AID H3 AID ChIP Ab H3 AID H3 AID H3 AID H3 AID Sμ Sμ ChIP Ab E p53 VDJ VDJ U Scrambled U Ptbp2 S CH12 U CH12 S IgA+ U IgA+ 2 5 3 6 1 4 8 7 ChIP (Relative Units) VDJ Eμ Iμ Cα Sμ Sα SUPPLEMENTARY FIGURE 1. Control samples/regions for ChIP analysis and representative gels.(A) Location of ChIP and sequencing primers within the Igh locus of an IgA+ CH12 cell. Positions of primers used for ChIP (designated by arrows with double lines) and sequencing (designated by arrows with solid lines) analyses are shown. Numbers within arrows correspond to primer sequence listed in Supplementary Table 2. All distances approximate. Presence of specified DNA region was quantitated by qPCR using sequence-specific primers. For n > 2, mean and standard deviation shown. (B) AID or H3 binding to Sμ or VDJ in unstimulated (U) CH12 or IgA+ cells. Two independent experiments shown. (C)AID or H3 binding to p53 sequence (negative control) in unstimulated (U)- and CIT-stimulated (S) CH12 and IgA+ cells. Two independent experiments shown. (D) AID or H3 binding to Sμ or VDJ in unstimulated (U) CH12 cells expressing either scrambled or Ptbp2 shRNA constructs; n = 4. (E) Binding of pS38-AID (pAID), RPA or H3 to p53 sequence (negative control) in CIT-stimulated (S) scrambled and Ptbp2-depleted (Ptbp2) CH12 cells; n = 3. (F-G) Representative gels of ChIP Sμ and VDJ qPCR reactions from unstimulated (U) and stimulated (S) (F) CH12 or IgA+ cells and (G) CH12 cells expressing either scrambled (Scr) or Ptbp2 shRNA constructs. 3 4 2 6 8 5 1 7 pAID RPA H3 pAID RPA H3 ChIP Ab S Ptbp2 S Scrambled
A B C SUPPLEMENTARY FIGURE 2.Igh V gene (VDJ) transcript levels and RGYW mutation spectra in shRNA-transduced CH12 cells. (A) Normalized fold change expression of VDJ transcripts quantitated by one-step qRT-PCR with SYBR Green in RNA harvested from unstimulated (U) or CIT-stimulated (S) CH12 cells expressing scrambled (Scr) or Ptbp2 shRNA constructs; n = 4. ‘Fold Change Expression’ was calculated using crossing threshold (Ct) values and the Pfaffl method for analyzing real-time data assuming 100% efficiency, which sets fold change expression equal to the ratio of [2 to the power of ΔCt target (control – treated)] over [2 to the power of ΔCt reference (control – treated)]; where target is VDJ, reference is β-actin, control is scrambled and treated is Ptbp2. For unstimulated samples U Scr was used as the control, while for stimulated samples S Scr was used as the control. Data represent the mean and error bars show standard deviation from the mean. RNA was isolated from 3 x 10⁶ CH12 cells cultured with or without CIT for 96 hours. VDJ primers used for ChIP analysis were used for qRT-PCR analysis. (B) Percentage unmutated (black) and mutated (gray) RGYW motifs found in total bases sequenced from the 5′ Sμ region or Igh V gene (VDJ) of CIT-stimulated scrambled or Ptbp2-depleted (Ptbp2) CH12 cells. (C) Total number of RGYW motifs: available for mutation (black), actually mutated (light gray), or expected to be mutated if mutation frequency was equivalent to that found in 5′ Sμ region (medium gray), of total Igh V gene (VDJ) bases sequenced from CIT-stimulated scrambled or Ptbp2-depleted (Ptbp2) CH12 cells. Data represent four independent samples.
SUPPLEMENTARY TABLE 1. Absolute number of mutations in the Igh V gene and S regions of IgA+ or CH12 cells.Mutation frequency expressed as number of unique mutations per total bases sequenced. Mutations present in the (A)IghV gene (VDJ) and (B)Sμ – Sα junction of unstimulated (U) or CIT-stimulated (S) IgA+ cells. The IgA+ cell line used for mutation analysis consisted of two clonal populations; both with the same Igh V gene, but with a different Sμ – Sα junction (indicated as either A or B sequences and mutations). Both A and B populations contained sequences with deletions and mutations (data not shown), indicating that AID was reactivated regardless of the Sμ – Sα junction expressed by the cell. One Sμ – Sα junction sequence contained 2 mutations, but was not included in the mutation frequency calculation since each mutation was also found in 2 separate sequences, and thus were not unique. Mutations present in the (C) Igh V gene (VDJ) and (D) 5′ Sμ region of unstimulated (U) or CIT-stimulated (S) CH12 cells expressing either scrambled or Ptbp2 shRNA constructs. Mutations in VDJ of Ptbp2-depleted CH12 cells continuously CIT-stimulated for 3 weeks (3 wks S Ptbp2) are also listed in (C). (E) Mutations (muts) at RGYW motifs in total bases sequenced from the 5′ Sμ region or Igh V gene (VDJ) of CIT-stimulated scrambled or Ptbp2-depleted (Ptbp2) CH12 cells. Percent RGYW mutations (% RGYW muts) expressed as number of RGYW motifs mutated (# RGYW muts) per total number of RGYW motifs sequenced (# RGYW motifs = number of sequences multiplied by number of RGYW motifs in sequenced region) multiplied by 100. Number expected if equal to 5′ Sμ region = 5′ Sμ % RGYW mutations multiplied by VDJ number RGYW motifs divided by 100. VDJ A. B. Sμ-Sα C. VDJ D. 5′ Sμ E. RGYW
SUPPLEMENTARY TABLE 2. Primer sequences. Name and nucleotide sequence of primers used in ChIP and mutational analyses are listed. Number corresponds to numbering depicted in Supplementary Figure 1A.