Understanding Different Types of Maps: Scales, Themes, and Spatial Thinking
390 likes | 624 Vues
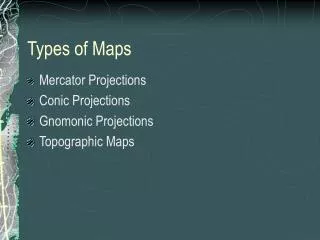
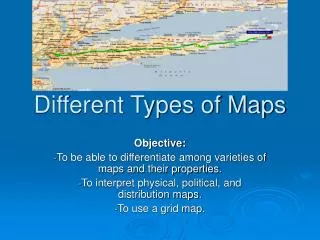
This guide delves into various types of maps, their scales, and the purpose behind each style. Explore how map scale represents distance, from representative fractions to verbal and bar scales. Discover the differences between large-scale and small-scale maps, along with reference maps that highlight both political and physical features. Learn about thematic maps, such as choropleth and dot maps, which convey specific data and patterns. Finally, engage in spatial thinking with examples of population density and resource distribution, enhancing your understanding of geographical contexts.

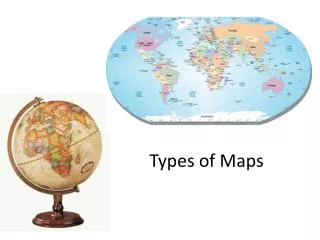
Understanding Different Types of Maps: Scales, Themes, and Spatial Thinking
E N D
Presentation Transcript
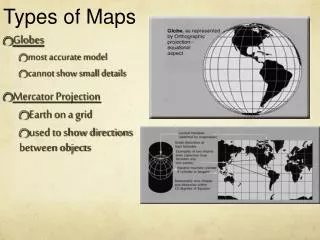
Map scale • distance on a map relative to the distance on Earth
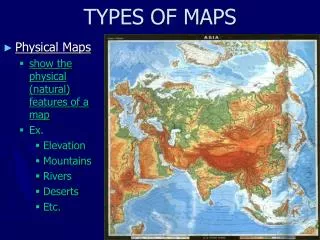
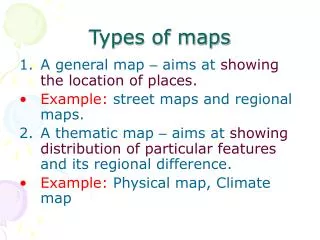
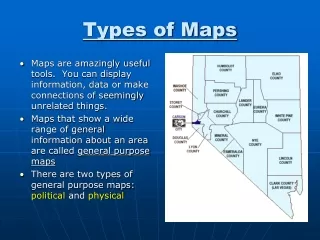
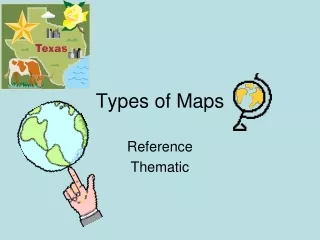
Reference Maps Reference Maps shows locations of places, as well as human and natural geographic features. Reference Maps shows locations of places, as well as human and natural geographic features.
Choropleth Choropleth map – uses shading to show different levels of data
Spatial thinking: Why are there higher levels of Latinos in southern Florida?
Spatial thinking: Why are the five red states using the most water?
Dot/Pin Dot Map Dot/Pin Dot Map– each dot represents a number of occurrences
Spatial thinking: Why is most of China’s population near the coast and NE area? • Population density map of China
Graduated Symbol Graduated Symbol – uses a symbol to show frequency or intensity of variable
Isoline Isoline map – connects points of equal value to make lines on a map
Cartograms Cartograms show size using data other than area
Mental / Perceptual Maps • Images of places we form based on our experiences and perceptions • What would your mental map be of: • Austin • Buddhism • Mars