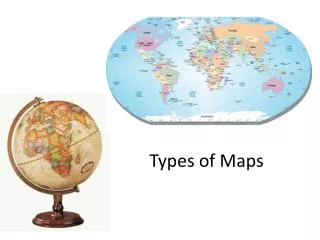
Types of Maps
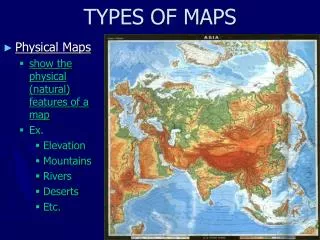
Types of Maps. Globes most accurate model cannot show small details Mercator Projection Earth on a grid used to show directions between objects. Types of Maps (cont’d). Robinson Projection show shapes and sizes accurately (except around the edges ) Conic Projection

Types of Maps
E N D
Presentation Transcript
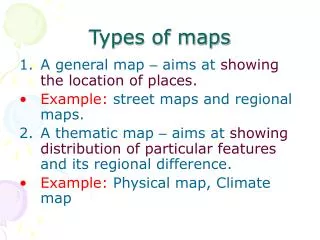
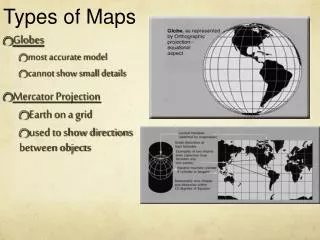
Types of Maps • Globes • most accurate model • cannot show small details • Mercator Projection • Earth on a grid • used to show directions between objects
Types of Maps (cont’d) • Robinson Projection • show shapes and sizes accurately (except around the edges) • Conic Projection • accurate at the lines of latitude • distorted in between the lines • used for street maps
Types of Maps (cont’d) • Gnonomic Projection • show the Poles • distances and directions are distorted • best to show the shortest distance between 2 points
Topographic Maps • Uses contour lines to show how elevation (distance above sea level) changes in a given land surface area.
Topographic Maps (cont’d)terminology • Contour lines show the differences in elevation; • Contour interval is the amount of change in elevation between two adjacent contour lines; • Contour lines will never touch or cross; each contour line represents only one height, or distance above sea level; • Can be combined with geologic maps, which show the type, age, and shape of various rock formations.
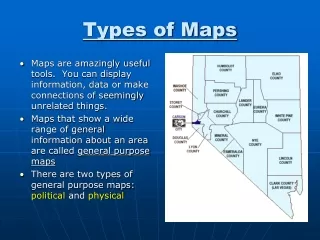
Topographic Map symbols • Circles (with no contour lines inside them) are hill/mountain tops, a high point where everything surrounding it is of lower elevation. • Circles with hachure marks are the opposite, low point or depression where the surrounding terrain is higher. • Coloring is often used to identify different rock types • The distance separating two adjacent contour lines indicates what the slope of steepness is: • Far apart = gentle slopes • Close together = steep slopes • Scales tell us how to convert the distance on the map to actual distance. For example 1 in. = 5 mi. lets us know that if you go from one point on the map to another that is 1 inch away, you will have actually traveled 5 miles.
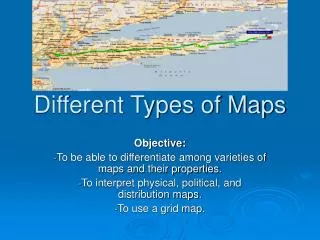
Imagine you wanted to convert this kind of landscape into a flat, portable, pocket-sized map. How would you use contour lines to do this?
A satellite view of the landscape with a latitude and longitude grid helps, but if we wanted to walk over this terrain would this be enough?
Topographic Maps This is an image from an actual topological map that. We are looking at a section of the Pisgah National Forest in North Carolina.
Now a closer view of the Topographic version • What features help you orient yourself? • Do you have a sense of the terrain? • How do these two version help understand the surface topology?
New Technologies available for mapmaking (cartography: cart = paper; graphos = draw)