Download
1 / 10
100 likes | 248 Vues
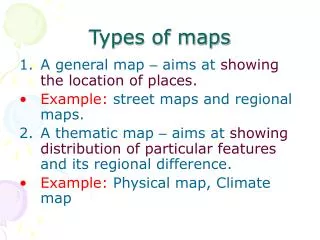
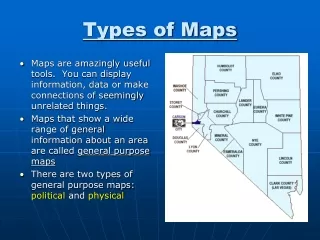
The Many Types Of Maps. Political Maps. Show man -made boundaries between countries , states, and provinces Also show important cities Identifies only major physical systems. Physical Maps. Show landforms and water features Show elevation using color or contour lines

E N D
The Many Types Of Maps
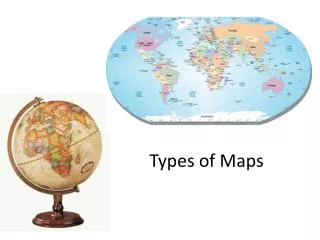
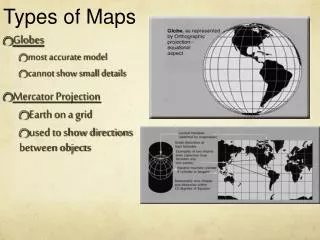
Political Maps • Show man-made boundaries between countries, states, and provinces • Also show important cities • Identifies only major physical systems
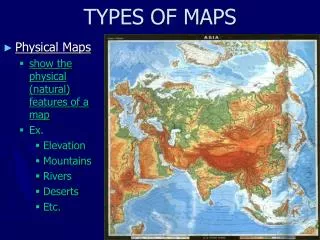
Physical Maps • Show landforms and water features • Show elevation using color or contour lines • Look at key to identify various colors used on the map
Contour Maps • Use lines to outline the shape – or contour- of the landscape • Each contour line connects all points that are at the same elevation. • If you walked along one contour line you would always be at the same height above sea level.
Special Purpose Maps • Used to present specific kinds of information • Usually show patterns • Make sure to notice the title and map key! • Examples: • Climate • Population • Land Use Resource • Topographic • …and many more!
Climate Maps • Show the average climates in a region • Climate is the usual, predictable pattern of weather in an area over a long period of time
Population Density Maps • Show patterns of where people live • Show how crowded a place is • Show size of cities (using dots or squares) and people per square mile or square kilometer (using colors)
Land Use Resource Maps ● Show patterns of land use, or the way people use the land they live on to meet their needs • Colors normally show land use patterns • Symbols normally show the locations of important resources • Also called “Economic Activity Maps”
Others • Time Zone Maps • Transportation Maps • Topographic Maps • Historical Maps • And MANY MORE!!