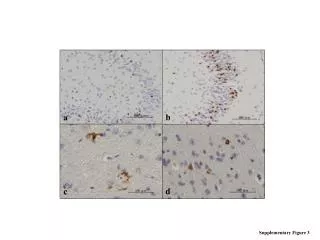
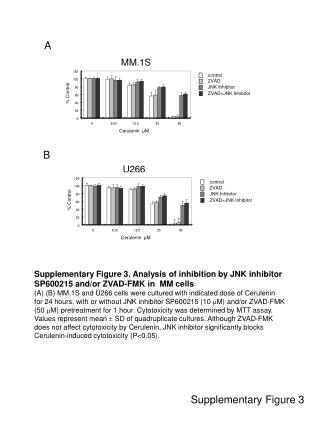
Analysis of JNK Inhibitor SP600215 and ZVAD-FMK on Cerulenin-Induced Cytotoxicity in MM Cells
This study examines the effects of the JNK inhibitor SP600215 and the pan-caspase inhibitor ZVAD-FMK on Cerulenin-induced cytotoxicity in multiple myeloma (MM) cell lines MM.1S and U266. Cells were treated with various concentrations of Cerulenin for 24 hours, with or without SP600215 (10 µM) and ZVAD-FMK (50 µM) pretreatment for one hour. Cytotoxicity was assessed using the MTT assay. Results indicate that while ZVAD-FMK does not influence Cerulenin's cytotoxicity, SP600215 significantly blocks its effects (P

Analysis of JNK Inhibitor SP600215 and ZVAD-FMK on Cerulenin-Induced Cytotoxicity in MM Cells
E N D
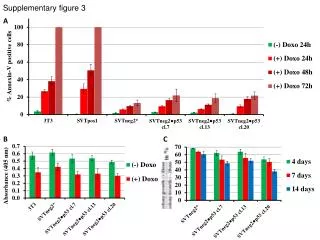
Presentation Transcript
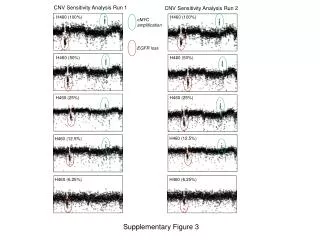
control control ZVAD ZVAD JNK Inhibitor JNK Inhibitor ZVAD+JNK Inhibitor ZVAD+JNK Inhibitor 120 100 80 % Control 60 40 20 0 0 6.25 12.5 25 50 Cerulenin μM U266 120 100 80 % Control 60 40 20 0 0 6.25 12.5 25 50 Cerulenin μM A MM.1S B Supplementary Figure 3. Analysis of inhibition by JNK inhibitor SP600215 and/or ZVAD-FMK in MM cells (A) (B) MM.1S and U266 cells were cultured with indicated dose of Cerulenin for 24 hours, with or without JNK inhibitor SP600215 (10 M) and/or ZVAD-FMK (50 M) pretreatment for 1 hour. Cytotoxicity was determined by MTT assay. Values represent mean SD of quadruplicate cultures. Although ZVAD-FMK does not affect cytotoxicity by Cerulenin, JNK inhibitor significantly blocks Cerulenin-induced cytotoxicity (P<0.05). Supplementary Figure 3