Download
1 / 1
Supplementary Figure 3
10 likes | 231 Vues
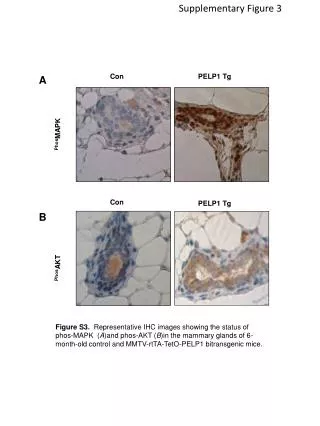
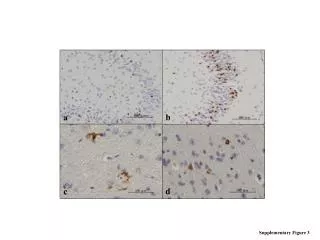
Supplementary Figure 3. PELP1 Tg. Con. A. Phos MAPK. Con. PELP1 Tg. B. Phos AKT. Figure S3. Representative IHC images showing the status of phos -MAPK ( A )and phos -AKT ( B )in the mammary glands of 6-month-old control and MMTV-rtTA-TetO-PELP1 bitransgenic mice.
Télécharger la présentation 
Supplementary Figure 3
An Image/Link below is provided (as is) to download presentation
Download Policy: Content on the Website is provided to you AS IS for your information and personal use and may not be sold / licensed / shared on other websites without getting consent from its author.
Content is provided to you AS IS for your information and personal use only.
Download presentation by click this link.
While downloading, if for some reason you are not able to download a presentation, the publisher may have deleted the file from their server.
During download, if you can't get a presentation, the file might be deleted by the publisher.
E N D
Presentation Transcript
Supplementary Figure 3 PELP1 Tg Con A PhosMAPK Con PELP1 Tg B PhosAKT Figure S3. Representative IHC images showing the status of phos-MAPK (A)and phos-AKT (B)in the mammary glands of 6-month-old control and MMTV-rtTA-TetO-PELP1 bitransgenic mice.
More Related