Analysis of Protein Expression in Various Cell Lines: Transferrin Receptor, Ferritin, and LC3
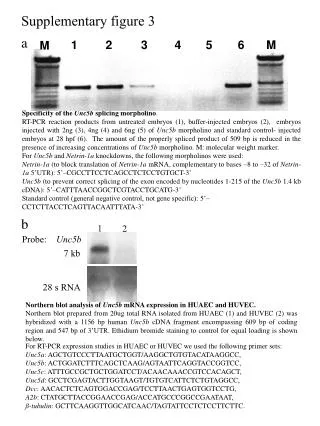
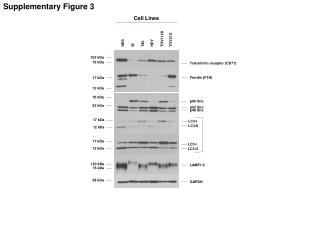
This supplementary figure showcases the protein expression profiles of several cell lines including TOV112D, TOV21G, and HEY. Key proteins analyzed include the transferrin receptor (CD71) at 102 kDa, ferritin (FTH) at 76 kDa, and various forms of Shc (p66, p52, p46) across different weights. Additionally, the expression of LC3-I and LC3-II at 12 kDa and 17 kDa, respectively, and LAMP1/2 at 76 kDa and 38 kDa are depicted. GAPDH is included as a loading control to ensure accuracy in the quantification of relative protein levels.

Analysis of Protein Expression in Various Cell Lines: Transferrin Receptor, Ferritin, and LC3
E N D
Presentation Transcript
Supplementary Figure 3 Cell Lines TOV112D TOV21G HEY HES T80 IE 102 kDa 76 kDa Transferrin receptor (CD71) Ferritin (FTH) 17 kDa 12 kDa 76 kDa p66 Shc 52 kDa p52 Shc p46 Shc 17 kDa LC3-I LC3-II 12 kDa 17 kDa LC3-I 12 kDa LC3-II 120 kDa LAMP1/2 76 kDa 38 kDa GAPDH