Impact of Doxo and DTX on ROS Generation and Apoptosis in iPrEC Cells: Insights from Flow Cytometry
10 likes | 126 Vues
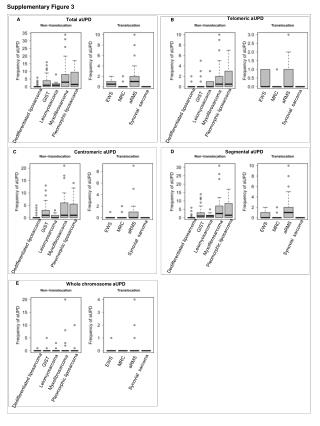
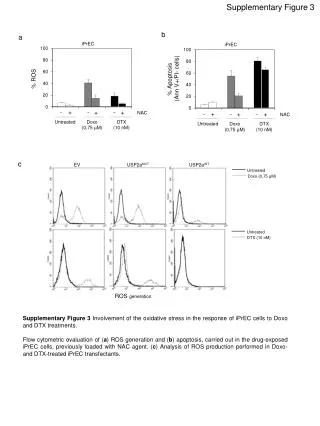
This study investigates the role of oxidative stress in iPrEC cell responses to Doxo (0.75 µM) and DTX (10 nM) treatments. Supplementary Figure 3 presents flow cytometric analyses of reactive oxygen species (ROS) generation and apoptosis rates in untreated and treated iPrEC cells, including those loaded with NAC. Additionally, a comparison of ROS production in Doxo and DTX-treated iPrEC transfectants is included. The findings illustrate the correlations between oxidative stress and cellular fate during chemotherapy.

Impact of Doxo and DTX on ROS Generation and Apoptosis in iPrEC Cells: Insights from Flow Cytometry
E N D
Presentation Transcript
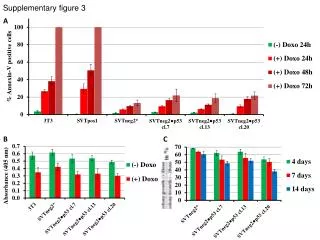
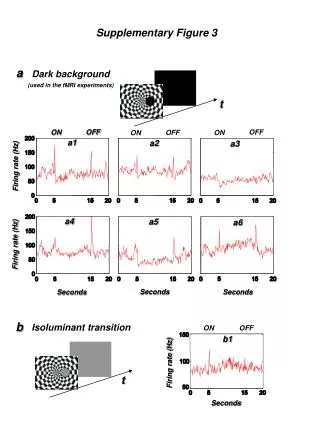
Supplementary Figure 3 a iPrEC Untreated Untreated Doxo (0,75 µM) DTX (10 nM) % ROS % Apoptosis (Ann V+/PI- cells) b iPrEC - - - - - - + + + + + + c NAC NAC EV USP2aMUT USP2aWT Untreated Untreated Doxo (0,75 µM) Doxo (0,75 µM) DTX (10 nM) DTX (10 nM) ROS generation Supplementary Figure 3 Involvement of the oxidative stress in the response of iPrEC cells to Doxo and DTX treatments. Flow cytometric evaluation of (a) ROS generation and (b) apoptosis, carried out in the drug-exposed iPrEC cells, previously loaded with NAC agent. (c) Analysis of ROS production performed in Doxo- and DTX-treated iPrEC transfectants.